[←][→] ath
| functional annotation | ||||||||||||||||||||||||||
| Function | RNI-like superfamily protein |


|
||||||||||||||||||||||||
| GO BP |
|
|||||||||||||||||||||||||
| GO CC |
|
|||||||||||||||||||||||||
| GO MF |
|
|||||||||||||||||||||||||
| KEGG | ||||||||||||||||||||||||||
| Protein | NP_565268.1 | |||||||||||||||||||||||||
| BLAST | NP_565268.1 | |||||||||||||||||||||||||
| Orthologous | [Ortholog page] LOC4345622 (osa) LOC7462685 (ppo) LOC11412387 (mtr) LOC100268116 (vvi) LOC100273105 (zma) LOC100806504 (gma) LOC101254415 (sly) LOC103827567 (bra) LOC103854052 (bra) | |||||||||||||||||||||||||
| Subcellular localization wolf |
|
|||||||||||||||||||||||||
| Subcellular localization TargetP |
|
|||||||||||||||||||||||||
| Gene coexpression | ||||||||||||||||||||||||||
| Network*for coexpressed genes |
|
|||||||||||||||||||||||||
|---|---|---|---|---|---|---|---|---|---|---|---|---|---|---|---|---|---|---|---|---|---|---|---|---|---|---|
| Coexpressed gene list |
[Coexpressed gene list for MEE11] | |||||||||||||||||||||||||
| Gene expression | ||||||||||||||||||||||||||
| All samples | [Expression pattern for all samples] | |||||||||||||||||||||||||
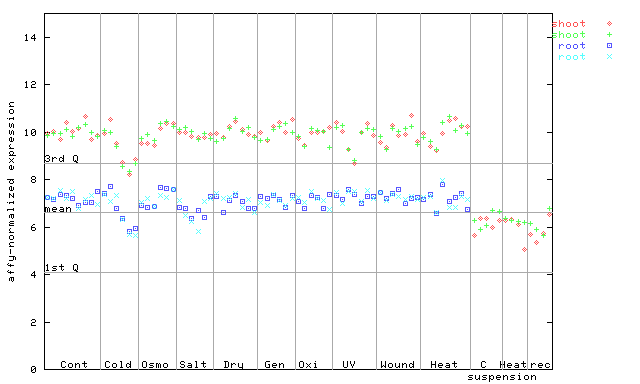
| AtGenExpress* (Development) |
265867_at
X axis is samples (pdf file), and Y axis is log2-expression. |
|||||||||||||||||||||||||
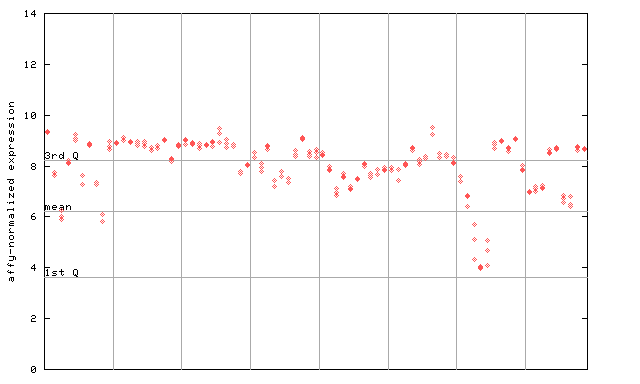
| AtGenExpress* (Stress) |
265867_at
X axis is samples (pdf file), and Y axis is log2-expression. |
|||||||||||||||||||||||||
| AtGenExpress* (Hormone) |
265867_at
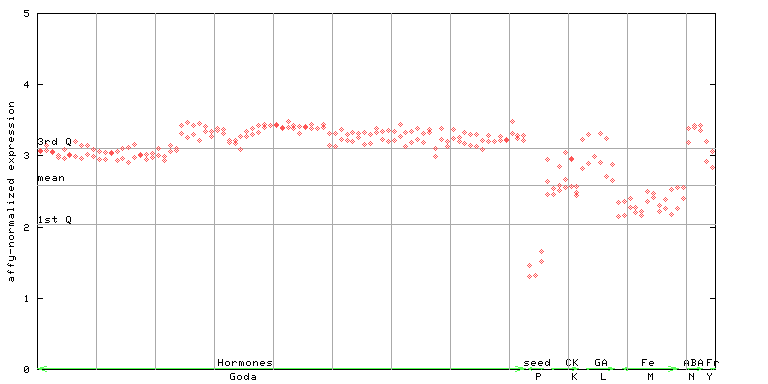
X axis is samples (xls file), and Y axis is log-expression. |
|||||||||||||||||||||||||


| Link to other DBs | ||
| Entrez Gene ID | 814691 |
|
| Refseq ID (protein) | NP_565268.1 | |
The preparation time of this page was 0.2 [sec].