[←][→] ath
| functional annotation | ||||||||||||||||||||||||||||||||||||||
| Function | hypothetical protein |


|
||||||||||||||||||||||||||||||||||||
| GO BP |
|
|||||||||||||||||||||||||||||||||||||
| GO CC |
|
|||||||||||||||||||||||||||||||||||||
| GO MF |
|
|||||||||||||||||||||||||||||||||||||
| KEGG | ||||||||||||||||||||||||||||||||||||||
| Protein | NP_001318199.1 NP_565317.1 | |||||||||||||||||||||||||||||||||||||
| BLAST | NP_001318199.1 NP_565317.1 | |||||||||||||||||||||||||||||||||||||
| Orthologous | [Ortholog page] LOC4334128 (osa) LOC7455990 (ppo) LOC11434222 (mtr) LOC100248237 (vvi) LOC100253366 (vvi) LOC100274792 (zma) LOC100527017 (gma) LOC100816932 (gma) LOC101256788 (sly) LOC103644015 (zma) LOC103828528 (bra) | |||||||||||||||||||||||||||||||||||||
| Subcellular localization wolf |
|
|||||||||||||||||||||||||||||||||||||
| Subcellular localization TargetP |
|
|||||||||||||||||||||||||||||||||||||
| Gene coexpression | ||||||||||||||||||||||||||||||||||||||
| Network*for coexpressed genes |
|
|||||||||||||||||||||||||||||||||||||
|---|---|---|---|---|---|---|---|---|---|---|---|---|---|---|---|---|---|---|---|---|---|---|---|---|---|---|---|---|---|---|---|---|---|---|---|---|---|---|
| Coexpressed gene list |
[Coexpressed gene list for AT2G04900] | |||||||||||||||||||||||||||||||||||||
| Gene expression | ||||||||||||||||||||||||||||||||||||||
| All samples | [Expression pattern for all samples] | |||||||||||||||||||||||||||||||||||||
| AtGenExpress* (Development) |
263631_at
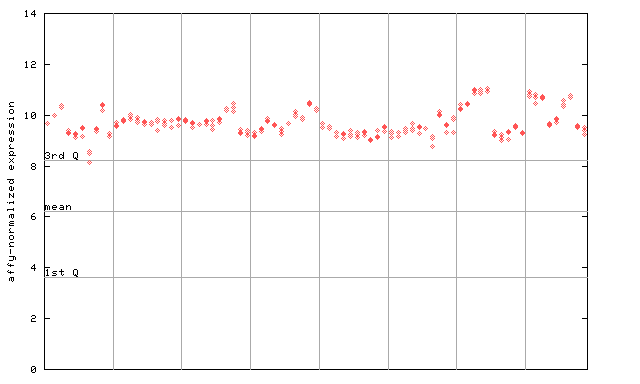
X axis is samples (pdf file), and Y axis is log2-expression. |
|||||||||||||||||||||||||||||||||||||
| AtGenExpress* (Stress) |
263631_at
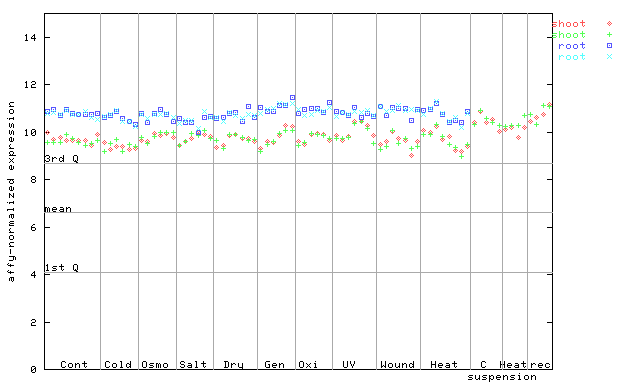
X axis is samples (pdf file), and Y axis is log2-expression. |
|||||||||||||||||||||||||||||||||||||
| AtGenExpress* (Hormone) |
263631_at
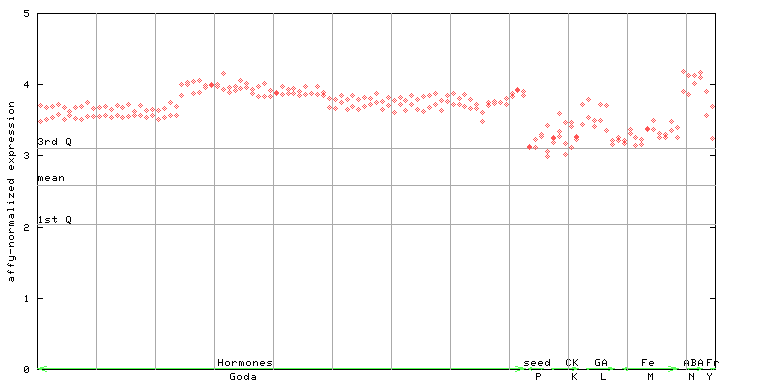
X axis is samples (xls file), and Y axis is log-expression. |
|||||||||||||||||||||||||||||||||||||


")
")
| Link to other DBs | ||
| Entrez Gene ID | 815037 |
|
| Refseq ID (protein) | NP_001318199.1 | |
| NP_565317.1 | |
|
The preparation time of this page was 0.1 [sec].