[←][→] ath
| functional annotation | ||||||||||||||||||||||||||||||||||
| Function | methyltransferase |


|
||||||||||||||||||||||||||||||||
| GO BP |
|
|||||||||||||||||||||||||||||||||
| GO CC |
|
|||||||||||||||||||||||||||||||||
| GO MF |
|
|||||||||||||||||||||||||||||||||
| KEGG | ||||||||||||||||||||||||||||||||||
| Protein | NP_001031382.1 NP_001189567.1 NP_179703.2 | |||||||||||||||||||||||||||||||||
| BLAST | NP_001031382.1 NP_001189567.1 NP_179703.2 | |||||||||||||||||||||||||||||||||
| Orthologous | [Ortholog page] LOC4328120 (osa) LOC100247029 (vvi) LOC100275693 (zma) LOC100802073 (gma) LOC100819552 (gma) LOC101254840 (sly) LOC103864244 (bra) LOC112421092 (mtr) | |||||||||||||||||||||||||||||||||
| Subcellular localization wolf |
|
|||||||||||||||||||||||||||||||||
| Subcellular localization TargetP |
|
|||||||||||||||||||||||||||||||||
| Gene coexpression | ||||||||||||||||||||||||||||||||||
| Network*for coexpressed genes |
|
|||||||||||||||||||||||||||||||||
|---|---|---|---|---|---|---|---|---|---|---|---|---|---|---|---|---|---|---|---|---|---|---|---|---|---|---|---|---|---|---|---|---|---|---|
| Coexpressed gene list |
[Coexpressed gene list for FIO1] | |||||||||||||||||||||||||||||||||
| Gene expression | ||||||||||||||||||||||||||||||||||
| All samples | [Expression pattern for all samples] | |||||||||||||||||||||||||||||||||
| AtGenExpress* (Development) |
264013_at
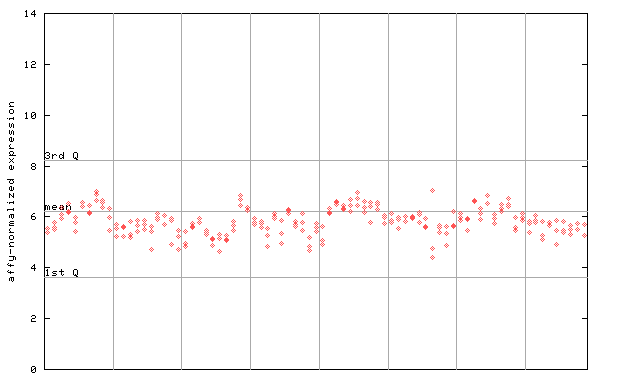
X axis is samples (pdf file), and Y axis is log2-expression. |
|||||||||||||||||||||||||||||||||
| AtGenExpress* (Stress) |
264013_at
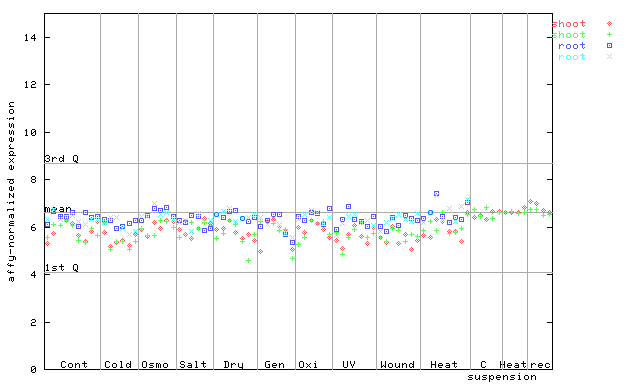
X axis is samples (pdf file), and Y axis is log2-expression. |
|||||||||||||||||||||||||||||||||
| AtGenExpress* (Hormone) |
264013_at
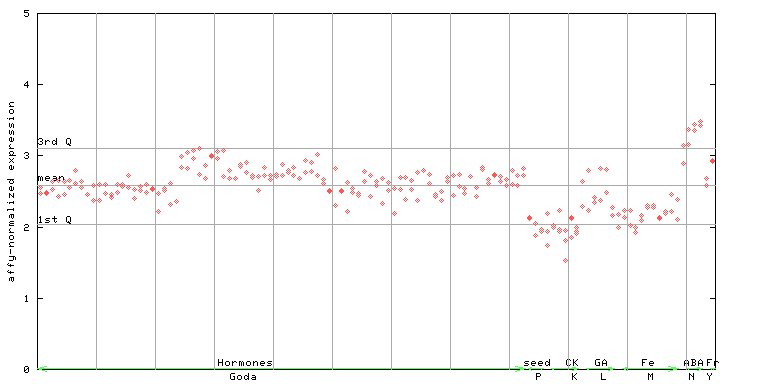
X axis is samples (xls file), and Y axis is log-expression. |
|||||||||||||||||||||||||||||||||


")
| Link to other DBs | ||
| Entrez Gene ID | 816642 |
|
| Refseq ID (protein) | NP_001031382.1 | |
| NP_001189567.1 | |
|
| NP_179703.2 | |
|
The preparation time of this page was 0.2 [sec].