[←][→] ath
| functional annotation | |||||||||||||||||||||||||||||||||||||||||||||||||||||||||||||||||||||||||||||||||||||
| Function | AmmeMemoRadiSam system protein B |


|
|||||||||||||||||||||||||||||||||||||||||||||||||||||||||||||||||||||||||||||||||||
| GO BP |
|
||||||||||||||||||||||||||||||||||||||||||||||||||||||||||||||||||||||||||||||||||||
| GO CC |
|
||||||||||||||||||||||||||||||||||||||||||||||||||||||||||||||||||||||||||||||||||||
| GO MF |
|
||||||||||||||||||||||||||||||||||||||||||||||||||||||||||||||||||||||||||||||||||||
| KEGG | |||||||||||||||||||||||||||||||||||||||||||||||||||||||||||||||||||||||||||||||||||||
| Protein | NP_565590.1 | ||||||||||||||||||||||||||||||||||||||||||||||||||||||||||||||||||||||||||||||||||||
| BLAST | NP_565590.1 | ||||||||||||||||||||||||||||||||||||||||||||||||||||||||||||||||||||||||||||||||||||
| Orthologous | [Ortholog page] LOC4345209 (osa) LOC7465404 (ppo) LOC7489127 (ppo) LOC25481928 (mtr) LOC100256144 (vvi) LOC100273137 (zma) LOC100815790 (gma) LOC101265261 (sly) LOC103842198 (bra) LOC103864621 (bra) | ||||||||||||||||||||||||||||||||||||||||||||||||||||||||||||||||||||||||||||||||||||
| Subcellular localization wolf |
|
||||||||||||||||||||||||||||||||||||||||||||||||||||||||||||||||||||||||||||||||||||
| Subcellular localization TargetP |
|
||||||||||||||||||||||||||||||||||||||||||||||||||||||||||||||||||||||||||||||||||||
| Gene coexpression | |||||||||||||||||||||||||||||||||||||||||||||||||||||||||||||||||||||||||||||||||||||
| Network*for coexpressed genes |
|
||||||||||||||||||||||||||||||||||||||||||||||||||||||||||||||||||||||||||||||||||||
|---|---|---|---|---|---|---|---|---|---|---|---|---|---|---|---|---|---|---|---|---|---|---|---|---|---|---|---|---|---|---|---|---|---|---|---|---|---|---|---|---|---|---|---|---|---|---|---|---|---|---|---|---|---|---|---|---|---|---|---|---|---|---|---|---|---|---|---|---|---|---|---|---|---|---|---|---|---|---|---|---|---|---|---|---|---|
| Coexpressed gene list |
[Coexpressed gene list for AT2G25280] | ||||||||||||||||||||||||||||||||||||||||||||||||||||||||||||||||||||||||||||||||||||
| Gene expression | |||||||||||||||||||||||||||||||||||||||||||||||||||||||||||||||||||||||||||||||||||||
| All samples | [Expression pattern for all samples] | ||||||||||||||||||||||||||||||||||||||||||||||||||||||||||||||||||||||||||||||||||||
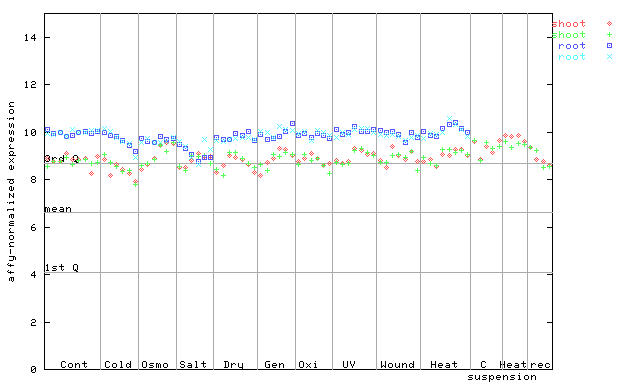
| AtGenExpress* (Development) |
263589_at
X axis is samples (pdf file), and Y axis is log2-expression. |
||||||||||||||||||||||||||||||||||||||||||||||||||||||||||||||||||||||||||||||||||||
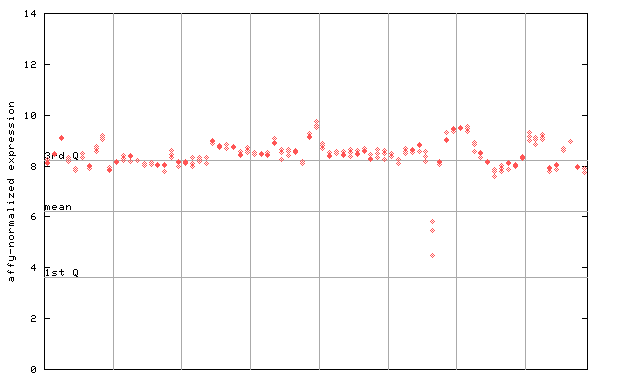
| AtGenExpress* (Stress) |
263589_at
X axis is samples (pdf file), and Y axis is log2-expression. |
||||||||||||||||||||||||||||||||||||||||||||||||||||||||||||||||||||||||||||||||||||
| AtGenExpress* (Hormone) |
263589_at
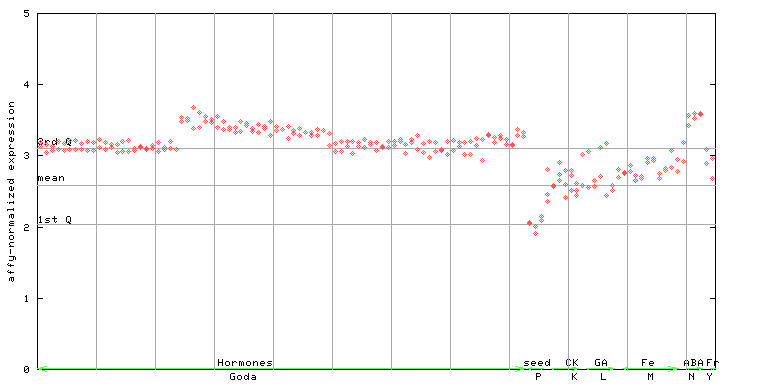
X axis is samples (xls file), and Y axis is log-expression. |
||||||||||||||||||||||||||||||||||||||||||||||||||||||||||||||||||||||||||||||||||||


")
")
")
")
")
| Link to other DBs | ||
| Entrez Gene ID | 817066 |
|
| Refseq ID (protein) | NP_565590.1 | |
The preparation time of this page was 0.1 [sec].