[←][→] ath
| functional annotation | |||||||||||||||||||||||||||||||||||||||||||
| Function | protein REVERSION-TO-ETHYLENE SENSITIVITY-like protein (DUF778) |


|
|||||||||||||||||||||||||||||||||||||||||
| GO BP |
|
||||||||||||||||||||||||||||||||||||||||||
| GO CC |
|
||||||||||||||||||||||||||||||||||||||||||
| GO MF |
|
||||||||||||||||||||||||||||||||||||||||||
| KEGG | ath04016 [list] [network] MAPK signaling pathway - plant (134 genes) |  |
|||||||||||||||||||||||||||||||||||||||||
| Protein | NP_001324625.1 NP_180177.2 | ||||||||||||||||||||||||||||||||||||||||||
| BLAST | NP_001324625.1 NP_180177.2 | ||||||||||||||||||||||||||||||||||||||||||
| Orthologous | [Ortholog page] LOC778264 (sly) LOC4325934 (osa) LOC4339461 (osa) LOC7470704 (ppo) LOC7476648 (ppo) LOC11418141 (mtr) LOC100193900 (zma) LOC100250722 (vvi) LOC100276634 (zma) LOC100278855 (zma) LOC100779664 (gma) LOC100817575 (gma) LOC103842162 (bra) | ||||||||||||||||||||||||||||||||||||||||||
| Subcellular localization wolf |
|
||||||||||||||||||||||||||||||||||||||||||
| Subcellular localization TargetP |
|
||||||||||||||||||||||||||||||||||||||||||
| Gene coexpression | |||||||||||||||||||||||||||||||||||||||||||
| Network*for coexpressed genes |
|
||||||||||||||||||||||||||||||||||||||||||
|---|---|---|---|---|---|---|---|---|---|---|---|---|---|---|---|---|---|---|---|---|---|---|---|---|---|---|---|---|---|---|---|---|---|---|---|---|---|---|---|---|---|---|---|
| Coexpressed gene list |
[Coexpressed gene list for RTE1] | ||||||||||||||||||||||||||||||||||||||||||
| Gene expression | |||||||||||||||||||||||||||||||||||||||||||
| All samples | [Expression pattern for all samples] | ||||||||||||||||||||||||||||||||||||||||||
| AtGenExpress* (Development) |
266893_at

X axis is samples (pdf file), and Y axis is log2-expression. |
||||||||||||||||||||||||||||||||||||||||||
| AtGenExpress* (Stress) |
266893_at
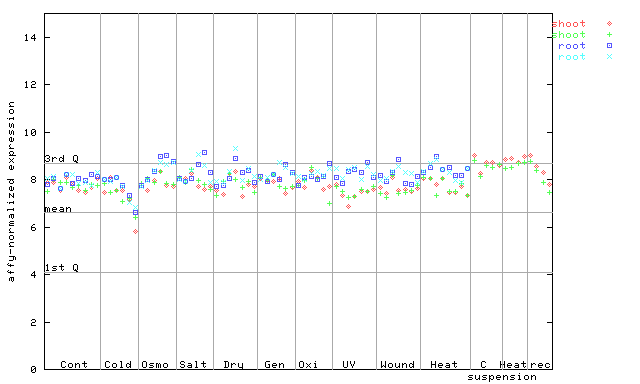
X axis is samples (pdf file), and Y axis is log2-expression. |
||||||||||||||||||||||||||||||||||||||||||
| AtGenExpress* (Hormone) |
266893_at
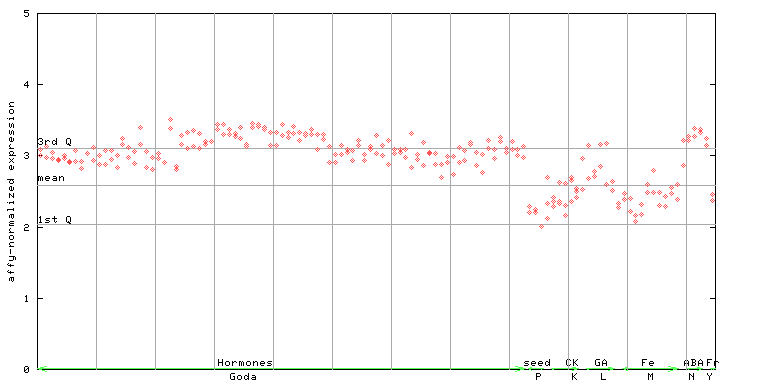
X axis is samples (xls file), and Y axis is log-expression. |
||||||||||||||||||||||||||||||||||||||||||


")
")
| Link to other DBs | ||
| Entrez Gene ID | 817148 |
|
| Refseq ID (protein) | NP_001324625.1 | |
| NP_180177.2 | |
|
The preparation time of this page was 0.2 [sec].