[←][→] ath
| functional annotation | ||||||||||
| Function | Transmembrane proteins 14C |


|
||||||||
| GO BP |
|
|||||||||
| GO CC |
|
|||||||||
| GO MF |
|
|||||||||
| KEGG | ||||||||||
| Protein | NP_180192.1 | |||||||||
| BLAST | NP_180192.1 | |||||||||
| Orthologous | [Ortholog page] AT3G43520 (ath) LOC4337241 (osa) LOC7491970 (ppo) LOC25494153 (mtr) LOC100217059 (zma) LOC100244242 (vvi) LOC100796329 (gma) LOC100814901 (gma) LOC101265099 (sly) LOC103842160 (bra) LOC103873633 (bra) | |||||||||
| Subcellular localization wolf |
|
|||||||||
| Subcellular localization TargetP |
|
|||||||||
| Gene coexpression | ||||||||||
| Network*for coexpressed genes |
||||||||||
|---|---|---|---|---|---|---|---|---|---|---|
| Coexpressed gene list |
[Coexpressed gene list for AT2G26240] | |||||||||
| Gene expression | ||||||||||
| All samples | [Expression pattern for all samples] | |||||||||
| AtGenExpress* (Development) |
267400_at
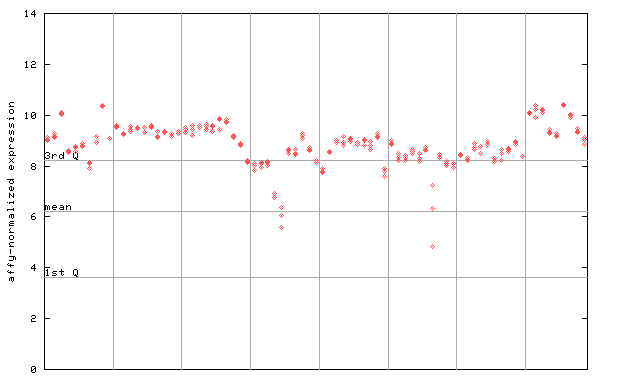
X axis is samples (pdf file), and Y axis is log2-expression. |
|||||||||
| AtGenExpress* (Stress) |
267400_at
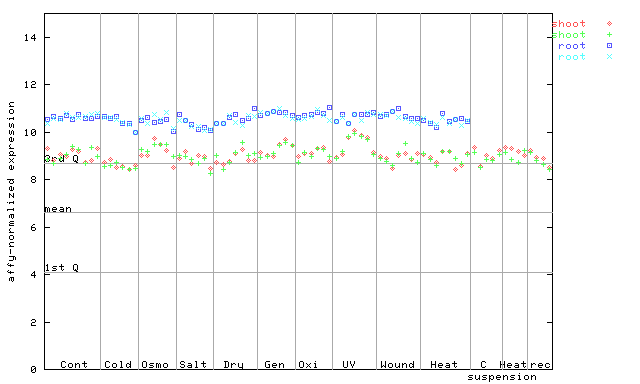
X axis is samples (pdf file), and Y axis is log2-expression. |
|||||||||
| AtGenExpress* (Hormone) |
267400_at
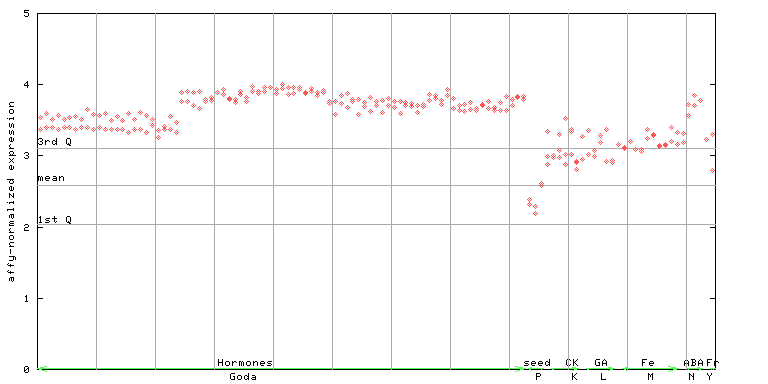
X axis is samples (xls file), and Y axis is log-expression. |
|||||||||


| Link to other DBs | ||
| Entrez Gene ID | 817164 |
|
| Refseq ID (protein) | NP_180192.1 | |
The preparation time of this page was 0.2 [sec].