[←][→] ath
| functional annotation | ||||||||||||||||||||||||||
| Function | AGC (cAMP-dependent, cGMP-dependent and protein kinase C) kinase family protein |


|
||||||||||||||||||||||||
| GO BP |
|
|||||||||||||||||||||||||
| GO CC |
|
|||||||||||||||||||||||||
| GO MF |
|
|||||||||||||||||||||||||
| KEGG | ||||||||||||||||||||||||||
| Protein | NP_180238.2 | |||||||||||||||||||||||||
| BLAST | NP_180238.2 | |||||||||||||||||||||||||
| Orthologous | [Ortholog page] LOC4327129 (osa) LOC7454701 (ppo) LOC11441185 (mtr) LOC100242344 (vvi) LOC100273930 (zma) LOC100775924 (gma) LOC100777988 (gma) LOC100787216 (gma) PK5 (sly) LOC103864742 (bra) | |||||||||||||||||||||||||
| Subcellular localization wolf |
|
|||||||||||||||||||||||||
| Subcellular localization TargetP |
|
|||||||||||||||||||||||||
| Gene coexpression | ||||||||||||||||||||||||||
| Network*for coexpressed genes |
|
|||||||||||||||||||||||||
|---|---|---|---|---|---|---|---|---|---|---|---|---|---|---|---|---|---|---|---|---|---|---|---|---|---|---|
| Coexpressed gene list |
[Coexpressed gene list for PID2] | |||||||||||||||||||||||||
| Gene expression | ||||||||||||||||||||||||||
| All samples | [Expression pattern for all samples] | |||||||||||||||||||||||||
| AtGenExpress* (Development) |
267613_at
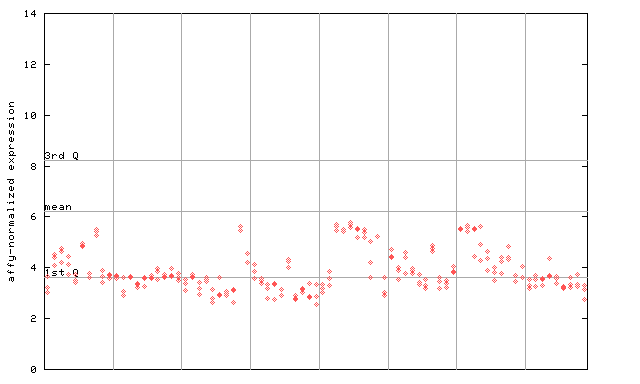
X axis is samples (pdf file), and Y axis is log2-expression. |
|||||||||||||||||||||||||
| AtGenExpress* (Stress) |
267613_at
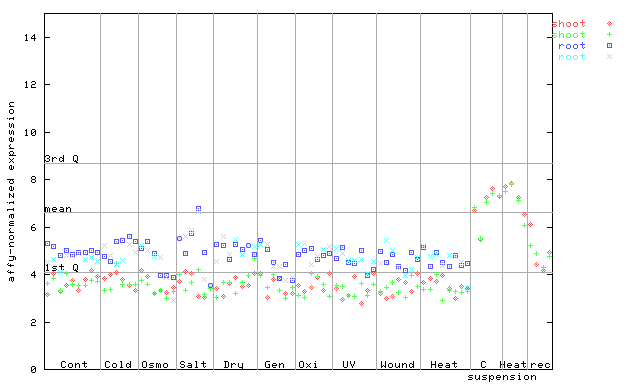
X axis is samples (pdf file), and Y axis is log2-expression. |
|||||||||||||||||||||||||
| AtGenExpress* (Hormone) |
267613_at
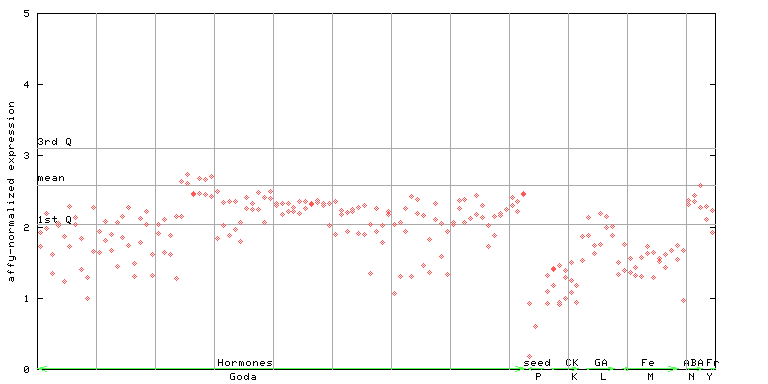
X axis is samples (xls file), and Y axis is log-expression. |
|||||||||||||||||||||||||


| Link to other DBs | ||
| Entrez Gene ID | 817211 |
|
| Refseq ID (protein) | NP_180238.2 | |
The preparation time of this page was 0.2 [sec].