[←][→] ath
| functional annotation | ||||||||||||||||||||||||||||||||||
| Function | Homeodomain-like superfamily protein |


|
||||||||||||||||||||||||||||||||
| GO BP |
|
|||||||||||||||||||||||||||||||||
| GO CC |
|
|||||||||||||||||||||||||||||||||
| GO MF |
|
|||||||||||||||||||||||||||||||||
| KEGG | ||||||||||||||||||||||||||||||||||
| Protein | NP_180429.1 | |||||||||||||||||||||||||||||||||
| BLAST | NP_180429.1 | |||||||||||||||||||||||||||||||||
| Orthologous | [Ortholog page] LOC542051 (zma) LOC542147 (zma) LOC11410919 (mtr) LOC100127511 (zma) LOC100260450 (vvi) LOC101253599 (sly) LOC101255167 (sly) LOC101266096 (sly) LOC102662354 (gma) LOC102663963 (gma) LOC103635953 (zma) LOC103858283 (bra) LOC103864903 (bra) LOC107275468 (osa) LOC107276476 (osa) | |||||||||||||||||||||||||||||||||
| Subcellular localization wolf |
|
|||||||||||||||||||||||||||||||||
| Subcellular localization TargetP |
|
|||||||||||||||||||||||||||||||||
| Gene coexpression | ||||||||||||||||||||||||||||||||||
| Network*for coexpressed genes |
||||||||||||||||||||||||||||||||||
|---|---|---|---|---|---|---|---|---|---|---|---|---|---|---|---|---|---|---|---|---|---|---|---|---|---|---|---|---|---|---|---|---|---|---|
| Coexpressed gene list |
[Coexpressed gene list for PRS] | |||||||||||||||||||||||||||||||||
| Gene expression | ||||||||||||||||||||||||||||||||||
| All samples | [Expression pattern for all samples] | |||||||||||||||||||||||||||||||||
| AtGenExpress* (Development) |
263434_at
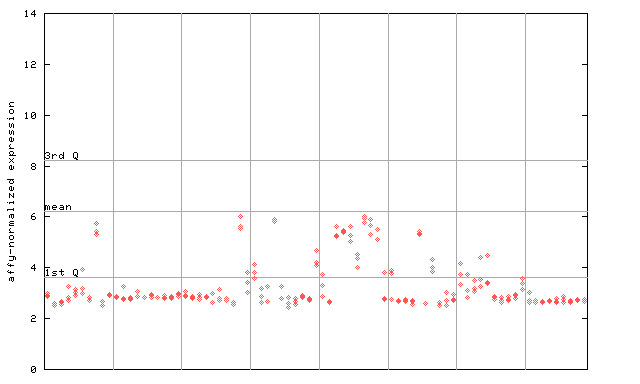
X axis is samples (pdf file), and Y axis is log2-expression. |
|||||||||||||||||||||||||||||||||
| AtGenExpress* (Stress) |
263434_at
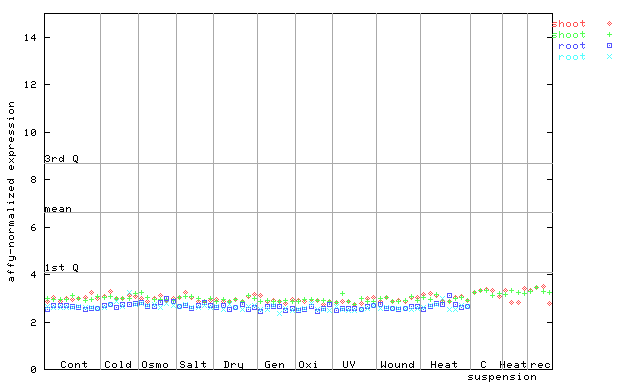
X axis is samples (pdf file), and Y axis is log2-expression. |
|||||||||||||||||||||||||||||||||
| AtGenExpress* (Hormone) |
263434_at
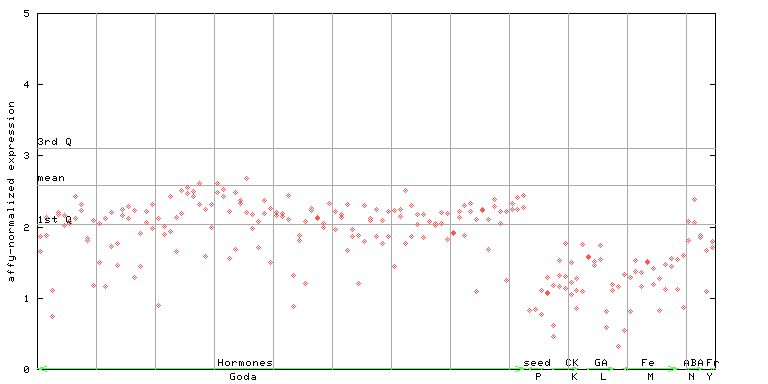
X axis is samples (xls file), and Y axis is log-expression. |
|||||||||||||||||||||||||||||||||

| Link to other DBs | ||
| Entrez Gene ID | 817410 |
|
| Refseq ID (protein) | NP_180429.1 | |
The preparation time of this page was 0.2 [sec].