[←][→] ath
| functional annotation | ||||||||||||||||||||||||||||||||||||||
| Function | para-aminobenzoate (PABA) synthase family protein |


|
||||||||||||||||||||||||||||||||||||
| GO BP |
|
|||||||||||||||||||||||||||||||||||||
| GO CC |
|
|||||||||||||||||||||||||||||||||||||
| GO MF |
|
|||||||||||||||||||||||||||||||||||||
| KEGG | ath00790 [list] [network] Folate biosynthesis (26 genes) |  |
||||||||||||||||||||||||||||||||||||
| Protein | NP_850127.1 | |||||||||||||||||||||||||||||||||||||
| BLAST | NP_850127.1 | |||||||||||||||||||||||||||||||||||||
| Orthologous | [Ortholog page] LOC543912 (sly) LOC4341959 (osa) LOC7458655 (ppo) LOC11408516 (mtr) LOC100258193 (vvi) LOC100263331 (vvi) LOC100804116 (gma) LOC100817174 (gma) LOC103629593 (zma) LOC103829774 (bra) LOC103864950 (bra) | |||||||||||||||||||||||||||||||||||||
| Subcellular localization wolf |
|
|||||||||||||||||||||||||||||||||||||
| Subcellular localization TargetP |
|
|||||||||||||||||||||||||||||||||||||
| Gene coexpression | ||||||||||||||||||||||||||||||||||||||
| Network*for coexpressed genes |
|
|||||||||||||||||||||||||||||||||||||
|---|---|---|---|---|---|---|---|---|---|---|---|---|---|---|---|---|---|---|---|---|---|---|---|---|---|---|---|---|---|---|---|---|---|---|---|---|---|---|
| Coexpressed gene list |
[Coexpressed gene list for emb1997] | |||||||||||||||||||||||||||||||||||||
| Gene expression | ||||||||||||||||||||||||||||||||||||||
| All samples | [Expression pattern for all samples] | |||||||||||||||||||||||||||||||||||||
| AtGenExpress* (Development) |
266219_at
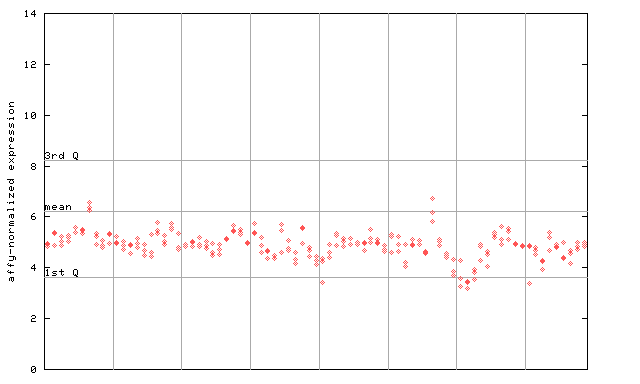
X axis is samples (pdf file), and Y axis is log2-expression. |
|||||||||||||||||||||||||||||||||||||
| AtGenExpress* (Stress) |
266219_at
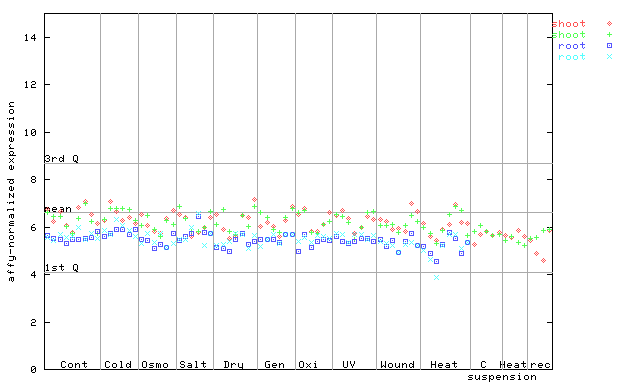
X axis is samples (pdf file), and Y axis is log2-expression. |
|||||||||||||||||||||||||||||||||||||
| AtGenExpress* (Hormone) |
266219_at
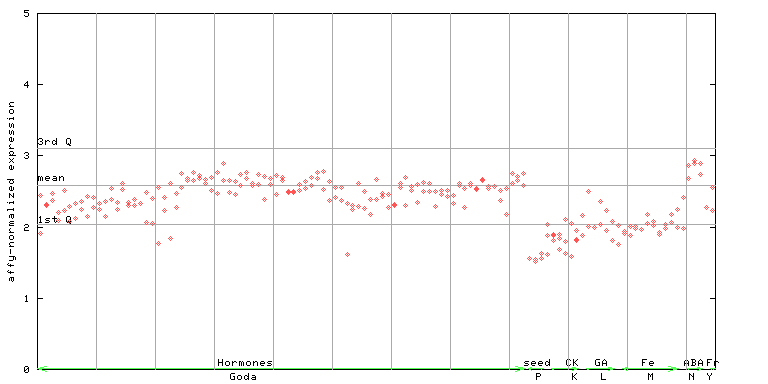
X axis is samples (xls file), and Y axis is log-expression. |
|||||||||||||||||||||||||||||||||||||


")
")
| Link to other DBs | ||
| Entrez Gene ID | 817437 |
|
| Refseq ID (protein) | NP_850127.1 | |
The preparation time of this page was 0.1 [sec].