[←][→] ath
| functional annotation | ||||||||||
| Function | allergen-like protein |


|
||||||||
| GO BP |
|
|||||||||
| GO CC |
|
|||||||||
| GO MF |
|
|||||||||
| KEGG | ||||||||||
| Protein | NP_001189638.1 NP_001324908.1 NP_850143.1 | |||||||||
| BLAST | NP_001189638.1 NP_001324908.1 NP_850143.1 | |||||||||
| Orthologous | [Ortholog page] LOC4339100 (osa) LOC7464728 (ppo) LOC7498129 (ppo) LOC11425926 (mtr) LOC100260387 (vvi) LOC100278334 (zma) LOC100779704 (gma) LOC100814100 (gma) LOC100815621 (gma) LOC101248013 (sly) LOC102659890 (gma) LOC103857313 (bra) LOC103865034 (bra) LOC107277763 (osa) | |||||||||
| Subcellular localization wolf |
|
|||||||||
| Subcellular localization TargetP |
|
|||||||||
| Gene coexpression | ||||||||||
| Network*for coexpressed genes |
||||||||||
|---|---|---|---|---|---|---|---|---|---|---|
| Coexpressed gene list |
||||||||||
| Gene expression | ||||||||||
| All samples | [Expression pattern for all samples] | |||||||||
| AtGenExpress* (Development) |
255867_at
X axis is samples (pdf file), and Y axis is log2-expression. |
|||||||||
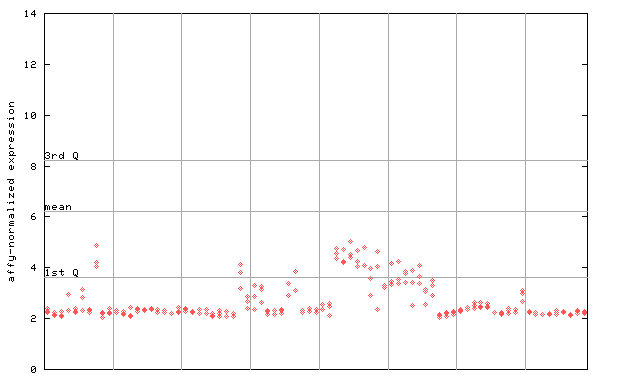
| AtGenExpress* (Stress) |
255867_at
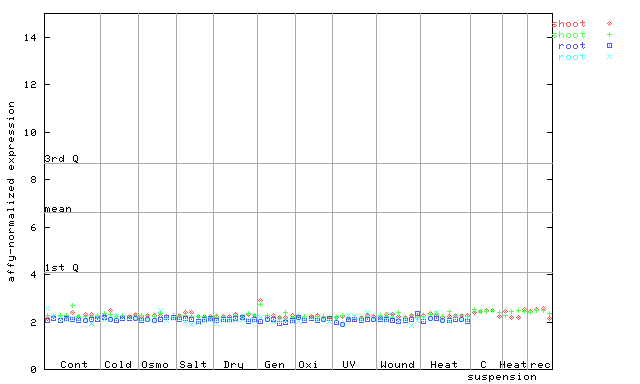
X axis is samples (pdf file), and Y axis is log2-expression. |
|||||||||
| AtGenExpress* (Hormone) |
255867_at
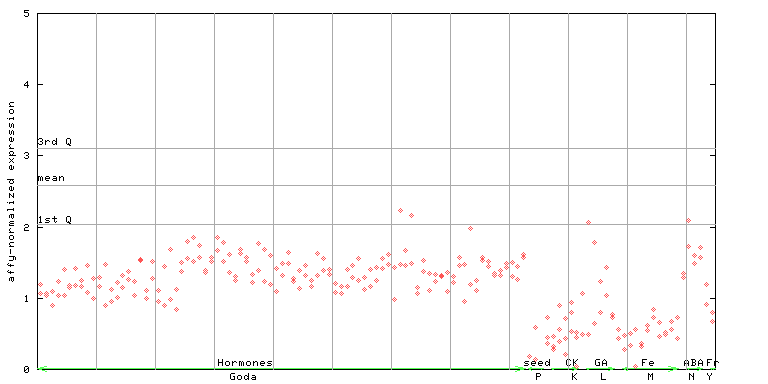
X axis is samples (xls file), and Y axis is log-expression. |
|||||||||

| Link to other DBs | ||
| Entrez Gene ID | 817587 |
|
| Refseq ID (protein) | NP_001189638.1 | |
| NP_001324908.1 | |
|
| NP_850143.1 | |
|
The preparation time of this page was 0.1 [sec].