[←][→] ath
| functional annotation | |||||||||||||||||||||||||||||||||||||||||||||||
| Function | urease accessory protein G |


|
|||||||||||||||||||||||||||||||||||||||||||||
| GO BP |
|
||||||||||||||||||||||||||||||||||||||||||||||
| GO CC |
|
||||||||||||||||||||||||||||||||||||||||||||||
| GO MF |
|
||||||||||||||||||||||||||||||||||||||||||||||
| KEGG | |||||||||||||||||||||||||||||||||||||||||||||||
| Protein | NP_001031481.1 NP_180994.1 | ||||||||||||||||||||||||||||||||||||||||||||||
| BLAST | NP_001031481.1 NP_180994.1 | ||||||||||||||||||||||||||||||||||||||||||||||
| Orthologous | [Ortholog page] EU3 (gma) LOC4339627 (osa) LOC7471145 (ppo) LOC11426174 (mtr) LOC100217046 (zma) LOC100243473 (vvi) LOC101244151 (sly) LOC103865338 (bra) | ||||||||||||||||||||||||||||||||||||||||||||||
| Subcellular localization wolf |
|
||||||||||||||||||||||||||||||||||||||||||||||
| Subcellular localization TargetP |
|
||||||||||||||||||||||||||||||||||||||||||||||
| Gene coexpression | |||||||||||||||||||||||||||||||||||||||||||||||
| Network*for coexpressed genes |
|
||||||||||||||||||||||||||||||||||||||||||||||
|---|---|---|---|---|---|---|---|---|---|---|---|---|---|---|---|---|---|---|---|---|---|---|---|---|---|---|---|---|---|---|---|---|---|---|---|---|---|---|---|---|---|---|---|---|---|---|---|
| Coexpressed gene list |
[Coexpressed gene list for UREG] | ||||||||||||||||||||||||||||||||||||||||||||||
| Gene expression | |||||||||||||||||||||||||||||||||||||||||||||||
| All samples | [Expression pattern for all samples] | ||||||||||||||||||||||||||||||||||||||||||||||
| AtGenExpress* (Development) |
267001_at
X axis is samples (pdf file), and Y axis is log2-expression. |
||||||||||||||||||||||||||||||||||||||||||||||
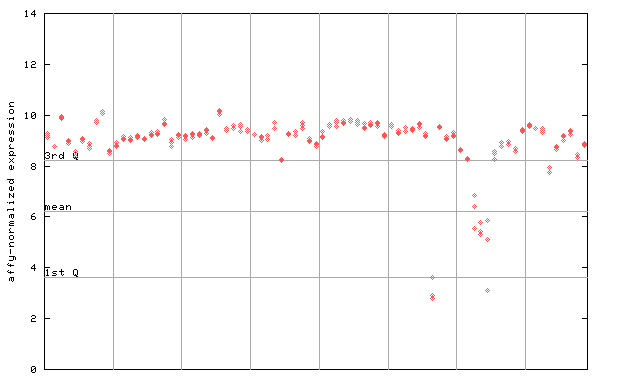
| AtGenExpress* (Stress) |
267001_at
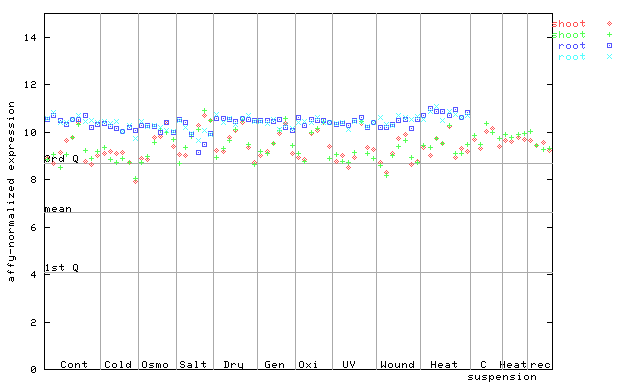
X axis is samples (pdf file), and Y axis is log2-expression. |
||||||||||||||||||||||||||||||||||||||||||||||
| AtGenExpress* (Hormone) |
267001_at
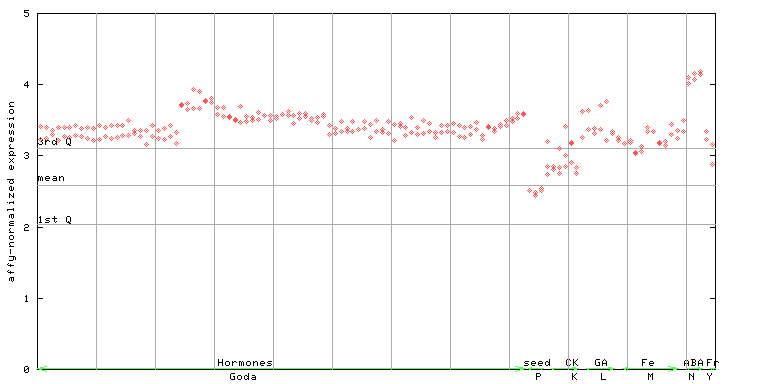
X axis is samples (xls file), and Y axis is log-expression. |
||||||||||||||||||||||||||||||||||||||||||||||


")
")
")
| Link to other DBs | ||
| Entrez Gene ID | 818010 |
|
| Refseq ID (protein) | NP_001031481.1 | |
| NP_180994.1 | |
|
The preparation time of this page was 0.2 [sec].