[←][→] ath
| functional annotation | ||||||||||||||||||||||||||||||||||
| Function | transmembrane protein |


|
||||||||||||||||||||||||||||||||
| GO BP |
|
|||||||||||||||||||||||||||||||||
| GO CC |
|
|||||||||||||||||||||||||||||||||
| GO MF |
|
|||||||||||||||||||||||||||||||||
| KEGG | ||||||||||||||||||||||||||||||||||
| Protein | NP_030665.1 | |||||||||||||||||||||||||||||||||
| BLAST | NP_030665.1 | |||||||||||||||||||||||||||||||||
| Orthologous | [Ortholog page] LOC7495697 (ppo) LOC11411504 (mtr) LOC100276236 (zma) LOC100276819 (zma) LOC100305712 (gma) LOC100780601 (gma) LOC101256163 (sly) LOC103857970 (bra) LOC104644355 (sly) LOC104880136 (vvi) LOC107276077 (osa) LOC112936017 (osa) | |||||||||||||||||||||||||||||||||
| Subcellular localization wolf |
|
|||||||||||||||||||||||||||||||||
| Subcellular localization TargetP |
|
|||||||||||||||||||||||||||||||||
| Gene coexpression | ||||||||||||||||||||||||||||||||||
| Network*for coexpressed genes |
|
|||||||||||||||||||||||||||||||||
|---|---|---|---|---|---|---|---|---|---|---|---|---|---|---|---|---|---|---|---|---|---|---|---|---|---|---|---|---|---|---|---|---|---|---|
| Coexpressed gene list |
[Coexpressed gene list for AT2G41200] | |||||||||||||||||||||||||||||||||
| Gene expression | ||||||||||||||||||||||||||||||||||
| All samples | [Expression pattern for all samples] | |||||||||||||||||||||||||||||||||
| AtGenExpress* (Development) |
267079_at
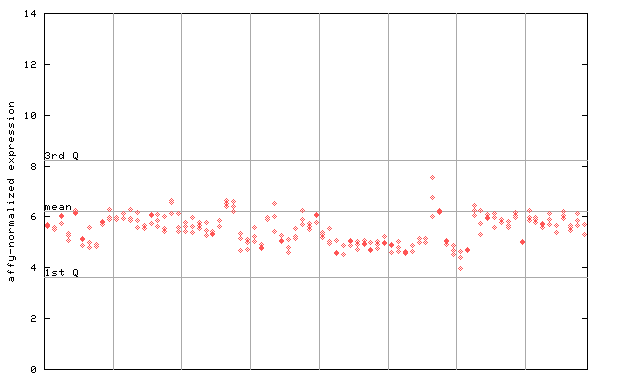
X axis is samples (pdf file), and Y axis is log2-expression. |
|||||||||||||||||||||||||||||||||
| AtGenExpress* (Stress) |
267079_at
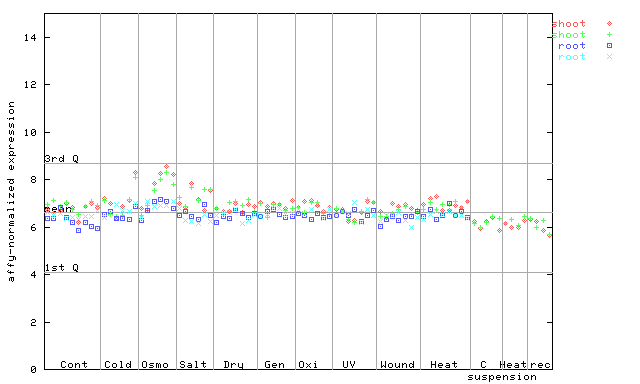
X axis is samples (pdf file), and Y axis is log2-expression. |
|||||||||||||||||||||||||||||||||
| AtGenExpress* (Hormone) |
267079_at
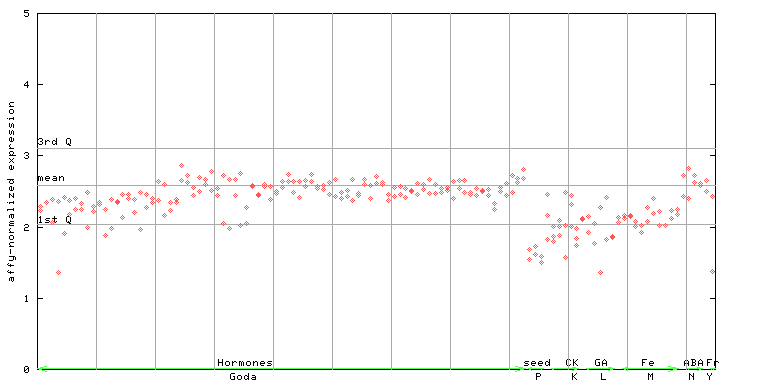
X axis is samples (xls file), and Y axis is log-expression. |
|||||||||||||||||||||||||||||||||


")
| Link to other DBs | ||
| Entrez Gene ID | 818719 |
|
| Refseq ID (protein) | NP_030665.1 | |
The preparation time of this page was 0.8 [sec].