[←][→] ath
| functional annotation | ||||||||||||||||||||||||||||||||||||||||||||||||||
| Function | molybdopterin biosynthesis MoaE family protein |


|
||||||||||||||||||||||||||||||||||||||||||||||||
| GO BP |
|
|||||||||||||||||||||||||||||||||||||||||||||||||
| GO CC |
|
|||||||||||||||||||||||||||||||||||||||||||||||||
| GO MF |
|
|||||||||||||||||||||||||||||||||||||||||||||||||
| KEGG | ath00790 [list] [network] Folate biosynthesis (26 genes) |  |
||||||||||||||||||||||||||||||||||||||||||||||||
| ath04122 [list] [network] Sulfur relay system (13 genes) | |
|||||||||||||||||||||||||||||||||||||||||||||||||
| Protein | NP_001078051.1 NP_001118518.1 NP_181904.1 | |||||||||||||||||||||||||||||||||||||||||||||||||
| BLAST | NP_001078051.1 NP_001118518.1 NP_181904.1 | |||||||||||||||||||||||||||||||||||||||||||||||||
| Orthologous | [Ortholog page] LOC4328260 (osa) LOC7480103 (ppo) LOC11407912 (mtr) LOC25501037 (mtr) LOC100241020 (vvi) LOC100266786 (vvi) LOC100284923 (zma) LOC100781775 (gma) LOC100786918 (gma) LOC100793056 (gma) LOC101243795 (sly) LOC103866106 (bra) LOC103866742 (bra) | |||||||||||||||||||||||||||||||||||||||||||||||||
| Subcellular localization wolf |
|
|||||||||||||||||||||||||||||||||||||||||||||||||
| Subcellular localization TargetP |
|
|||||||||||||||||||||||||||||||||||||||||||||||||
| Gene coexpression | ||||||||||||||||||||||||||||||||||||||||||||||||||
| Network*for coexpressed genes |
|
|||||||||||||||||||||||||||||||||||||||||||||||||
|---|---|---|---|---|---|---|---|---|---|---|---|---|---|---|---|---|---|---|---|---|---|---|---|---|---|---|---|---|---|---|---|---|---|---|---|---|---|---|---|---|---|---|---|---|---|---|---|---|---|---|
| Coexpressed gene list |
[Coexpressed gene list for AT2G43760] | |||||||||||||||||||||||||||||||||||||||||||||||||
| Gene expression | ||||||||||||||||||||||||||||||||||||||||||||||||||
| All samples | [Expression pattern for all samples] | |||||||||||||||||||||||||||||||||||||||||||||||||
| AtGenExpress* (Development) |
260572_at
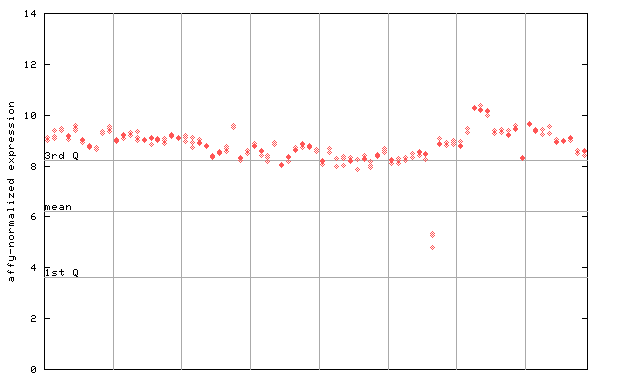
X axis is samples (pdf file), and Y axis is log2-expression. |
|||||||||||||||||||||||||||||||||||||||||||||||||
| AtGenExpress* (Stress) |
260572_at
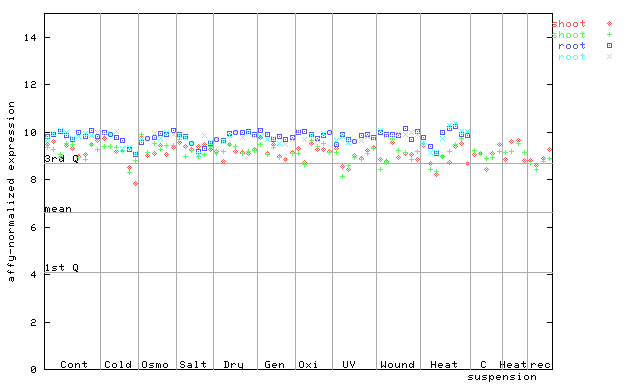
X axis is samples (pdf file), and Y axis is log2-expression. |
|||||||||||||||||||||||||||||||||||||||||||||||||
| AtGenExpress* (Hormone) |
260572_at
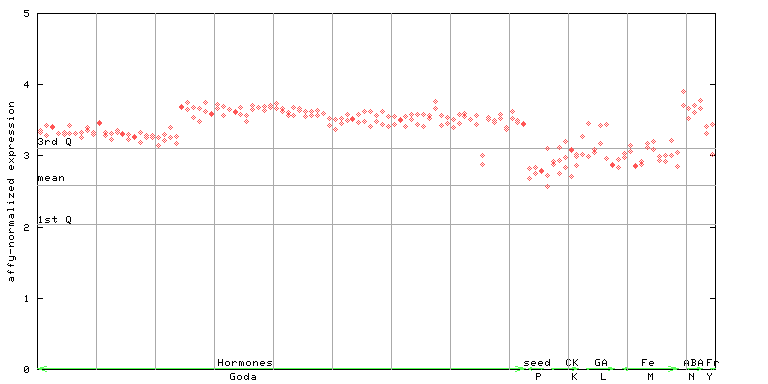
X axis is samples (xls file), and Y axis is log-expression. |
|||||||||||||||||||||||||||||||||||||||||||||||||


")
")
")
")
")
| Link to other DBs | ||
| Entrez Gene ID | 818979 |
|
| Refseq ID (protein) | NP_001078051.1 | |
| NP_001118518.1 | |
|
| NP_181904.1 | |
|
The preparation time of this page was 0.2 [sec].