[←][→] ath
| functional annotation | |||||||||||||||||||||||||||||||
| Function | calcineurin B subunit-like protein |


|
|||||||||||||||||||||||||||||
| GO BP |
|
||||||||||||||||||||||||||||||
| GO CC |
|
||||||||||||||||||||||||||||||
| GO MF |
|
||||||||||||||||||||||||||||||
| KEGG | ath00564 [list] [network] Glycerophospholipid metabolism (96 genes) |  |
|||||||||||||||||||||||||||||
| ath00565 [list] [network] Ether lipid metabolism (26 genes) | |
||||||||||||||||||||||||||||||
| Protein | NP_566051.1 NP_566052.1 | ||||||||||||||||||||||||||||||
| BLAST | NP_566051.1 NP_566052.1 | ||||||||||||||||||||||||||||||
| Orthologous | [Ortholog page] LOC4342043 (osa) LOC7464884 (ppo) LOC25500989 (mtr) LOC100191712 (zma) LOC100262557 (vvi) LOC100281778 (zma) LOC100815908 (gma) LOC100818109 (gma) LOC101267740 (sly) LOC103858180 (bra) LOC103866226 (bra) | ||||||||||||||||||||||||||||||
| Subcellular localization wolf |
|
||||||||||||||||||||||||||||||
| Subcellular localization TargetP |
|
||||||||||||||||||||||||||||||
| Gene coexpression | |||||||||||||||||||||||||||||||
| Network*for coexpressed genes |
|
||||||||||||||||||||||||||||||
|---|---|---|---|---|---|---|---|---|---|---|---|---|---|---|---|---|---|---|---|---|---|---|---|---|---|---|---|---|---|---|---|
| Coexpressed gene list |
[Coexpressed gene list for AT2G45670] | ||||||||||||||||||||||||||||||
| Gene expression | |||||||||||||||||||||||||||||||
| All samples | [Expression pattern for all samples] | ||||||||||||||||||||||||||||||
| AtGenExpress* (Development) |
267511_at
X axis is samples (pdf file), and Y axis is log2-expression. |
||||||||||||||||||||||||||||||
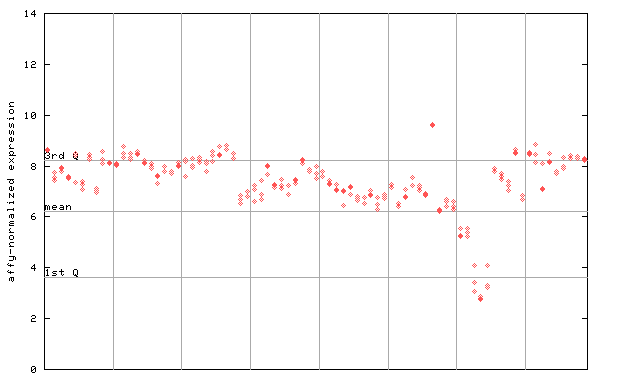
| AtGenExpress* (Stress) |
267511_at
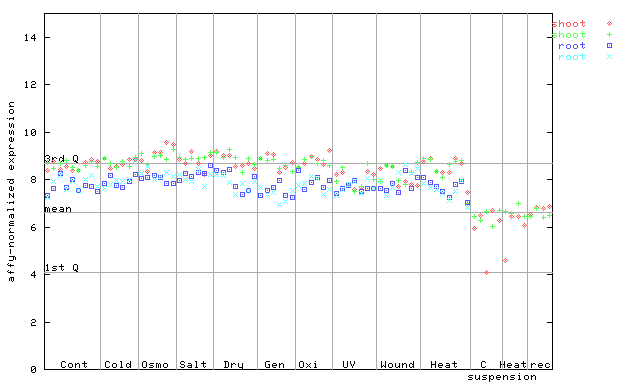
X axis is samples (pdf file), and Y axis is log2-expression. |
||||||||||||||||||||||||||||||
| AtGenExpress* (Hormone) |
267511_at
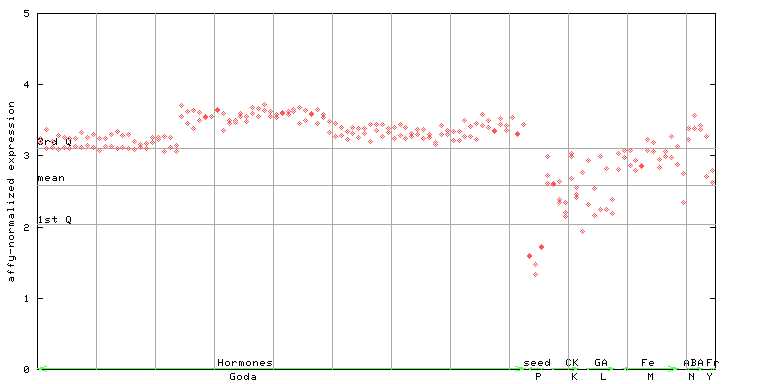
X axis is samples (xls file), and Y axis is log-expression. |
||||||||||||||||||||||||||||||


| Link to other DBs | ||
| Entrez Gene ID | 819175 |
|
| Refseq ID (protein) | NP_566051.1 | |
| NP_566052.1 | |
|
The preparation time of this page was 0.2 [sec].