[←][→] ath
| functional annotation | |||||||||||||||||||||||||||||||
| Function | Protein of unknown function, transmembrane-40 |


|
|||||||||||||||||||||||||||||
| GO BP |
|
||||||||||||||||||||||||||||||
| GO CC |
|
||||||||||||||||||||||||||||||
| GO MF |
|
||||||||||||||||||||||||||||||
| KEGG | |||||||||||||||||||||||||||||||
| Protein | NP_566244.1 | ||||||||||||||||||||||||||||||
| BLAST | NP_566244.1 | ||||||||||||||||||||||||||||||
| Orthologous | [Ortholog page] Cand8 (ath) LOC4334158 (osa) LOC7473900 (ppo) LOC25484671 (mtr) LOC100192697 (zma) LOC100216647 (zma) LOC100264088 (vvi) LOC100499855 (gma) LOC100783834 (gma) LOC100783991 (gma) LOC100819854 (gma) LOC101251927 (sly) LOC103837324 (bra) LOC103859073 (bra) | ||||||||||||||||||||||||||||||
| Subcellular localization wolf |
|
||||||||||||||||||||||||||||||
| Subcellular localization TargetP |
|
||||||||||||||||||||||||||||||
| Gene coexpression | |||||||||||||||||||||||||||||||
| Network*for coexpressed genes |
|
||||||||||||||||||||||||||||||
|---|---|---|---|---|---|---|---|---|---|---|---|---|---|---|---|---|---|---|---|---|---|---|---|---|---|---|---|---|---|---|---|
| Coexpressed gene list |
[Coexpressed gene list for Cand2] | ||||||||||||||||||||||||||||||
| Gene expression | |||||||||||||||||||||||||||||||
| All samples | [Expression pattern for all samples] | ||||||||||||||||||||||||||||||
| AtGenExpress* (Development) |
259099_at
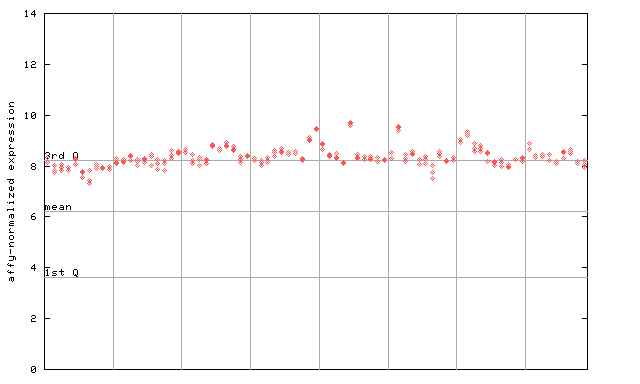
X axis is samples (pdf file), and Y axis is log2-expression. |
||||||||||||||||||||||||||||||
| AtGenExpress* (Stress) |
259099_at
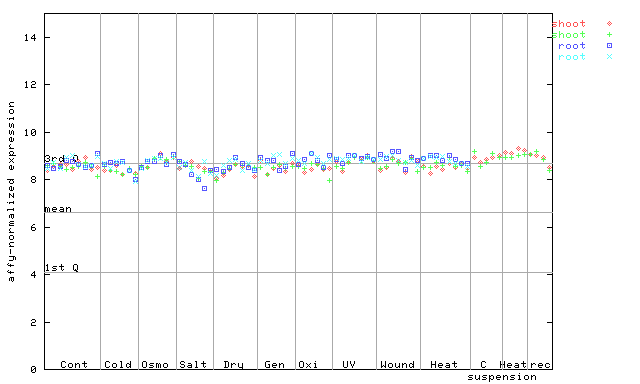
X axis is samples (pdf file), and Y axis is log2-expression. |
||||||||||||||||||||||||||||||
| AtGenExpress* (Hormone) |
259099_at
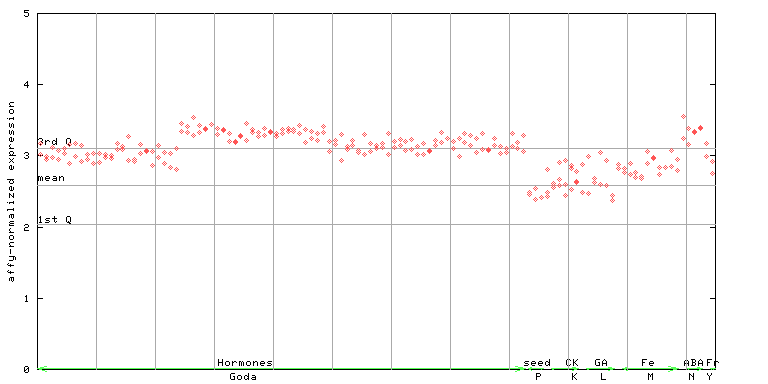
X axis is samples (xls file), and Y axis is log-expression. |
||||||||||||||||||||||||||||||


| Link to other DBs | ||
| Entrez Gene ID | 819662 |
|
| Refseq ID (protein) | NP_566244.1 | |
The preparation time of this page was 0.2 [sec].