[←][→] ath
| functional annotation | ||||||||||||||||||||||||||||||||||||
| Function | Calcium-binding EF-hand family protein |


|
||||||||||||||||||||||||||||||||||
| GO BP |
|
|||||||||||||||||||||||||||||||||||
| GO CC |
|
|||||||||||||||||||||||||||||||||||
| GO MF |
|
|||||||||||||||||||||||||||||||||||
| KEGG | ath04626 [list] [network] Plant-pathogen interaction (170 genes) |  |
||||||||||||||||||||||||||||||||||
| Protein | NP_001030668.1 NP_001189854.1 NP_001327262.1 NP_187641.2 NP_850997.1 NP_850998.1 | |||||||||||||||||||||||||||||||||||
| BLAST | NP_001030668.1 NP_001189854.1 NP_001327262.1 NP_187641.2 NP_850997.1 NP_850998.1 | |||||||||||||||||||||||||||||||||||
| Orthologous | ||||||||||||||||||||||||||||||||||||
| Subcellular localization wolf |
|
|||||||||||||||||||||||||||||||||||
| Subcellular localization TargetP |
|
|||||||||||||||||||||||||||||||||||
| Gene coexpression | ||||||||||||||||||||||||||||||||||||
| Network*for coexpressed genes |
|
|||||||||||||||||||||||||||||||||||
|---|---|---|---|---|---|---|---|---|---|---|---|---|---|---|---|---|---|---|---|---|---|---|---|---|---|---|---|---|---|---|---|---|---|---|---|---|
| Coexpressed gene list |
[Coexpressed gene list for AT3G10300] | |||||||||||||||||||||||||||||||||||
| Gene expression | ||||||||||||||||||||||||||||||||||||
| All samples | [Expression pattern for all samples] | |||||||||||||||||||||||||||||||||||
| AtGenExpress* (Development) |
259137_at
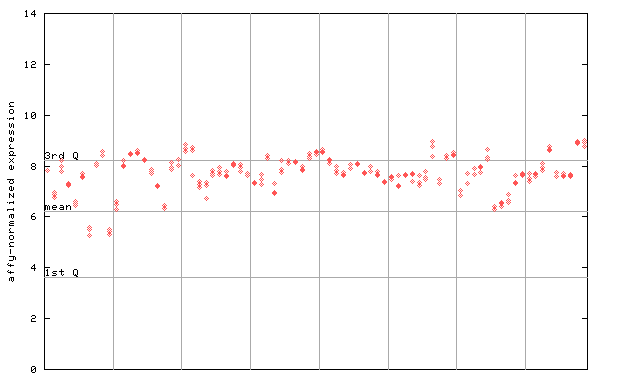
X axis is samples (pdf file), and Y axis is log2-expression. |
|||||||||||||||||||||||||||||||||||
| AtGenExpress* (Stress) |
259137_at
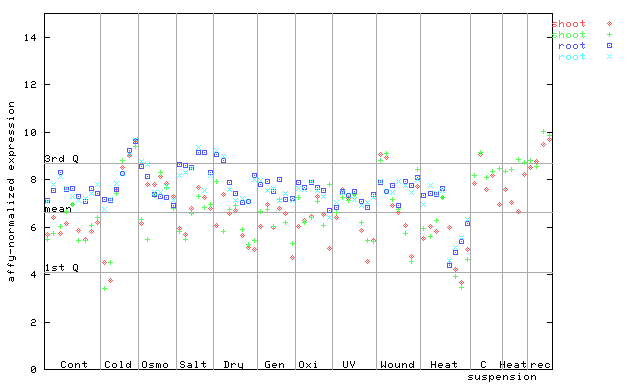
X axis is samples (pdf file), and Y axis is log2-expression. |
|||||||||||||||||||||||||||||||||||
| AtGenExpress* (Hormone) |
259137_at
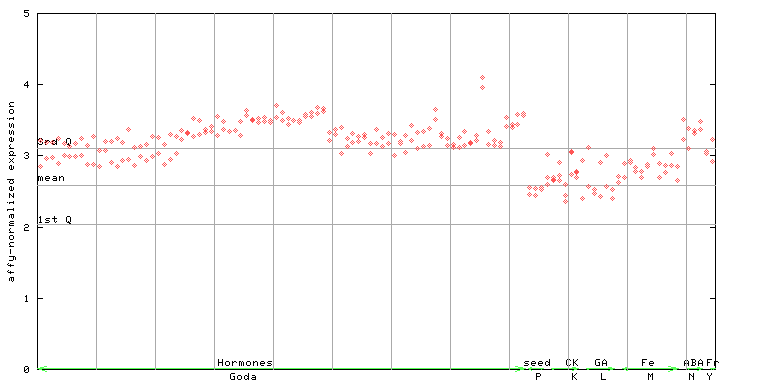
X axis is samples (xls file), and Y axis is log-expression. |
|||||||||||||||||||||||||||||||||||


| Link to other DBs | ||
| Entrez Gene ID | 820192 |
|
| Refseq ID (protein) | NP_001030668.1 | |
| NP_001189854.1 | |
|
| NP_001327262.1 | |
|
| NP_187641.2 | |
|
| NP_850997.1 | |
|
| NP_850998.1 | |
|
The preparation time of this page was 0.2 [sec].