[←][→] ath
| functional annotation | ||||||||||||||||||||||||||||||||||||||||||||||
| Function | short-chain dehydrogenase-reductase B |


|
||||||||||||||||||||||||||||||||||||||||||||
| GO BP |
|
|||||||||||||||||||||||||||||||||||||||||||||
| GO CC |
|
|||||||||||||||||||||||||||||||||||||||||||||
| GO MF |
|
|||||||||||||||||||||||||||||||||||||||||||||
| KEGG | ath04146 [list] [network] Peroxisome (87 genes) |  |
||||||||||||||||||||||||||||||||||||||||||||
| Protein | NP_187886.2 | |||||||||||||||||||||||||||||||||||||||||||||
| BLAST | NP_187886.2 | |||||||||||||||||||||||||||||||||||||||||||||
| Orthologous | [Ortholog page] LOC4336981 (osa) LOC7479623 (ppo) LOC25502359 (mtr) LOC100194355 (zma) LOC100248493 (vvi) LOC100257583 (vvi) LOC100793630 (gma) LOC100800885 (gma) LOC101254404 (sly) LOC103504713 (zma) LOC103859468 (bra) LOC103870224 (bra) | |||||||||||||||||||||||||||||||||||||||||||||
| Subcellular localization wolf |
|
|||||||||||||||||||||||||||||||||||||||||||||
| Subcellular localization TargetP |
|
|||||||||||||||||||||||||||||||||||||||||||||
| Gene coexpression | ||||||||||||||||||||||||||||||||||||||||||||||
| Network*for coexpressed genes |
|
|||||||||||||||||||||||||||||||||||||||||||||
|---|---|---|---|---|---|---|---|---|---|---|---|---|---|---|---|---|---|---|---|---|---|---|---|---|---|---|---|---|---|---|---|---|---|---|---|---|---|---|---|---|---|---|---|---|---|---|
| Coexpressed gene list |
[Coexpressed gene list for SDRB] | |||||||||||||||||||||||||||||||||||||||||||||
| Gene expression | ||||||||||||||||||||||||||||||||||||||||||||||
| All samples | [Expression pattern for all samples] | |||||||||||||||||||||||||||||||||||||||||||||
| AtGenExpress* (Development) |
257687_at
X axis is samples (pdf file), and Y axis is log2-expression. |
|||||||||||||||||||||||||||||||||||||||||||||
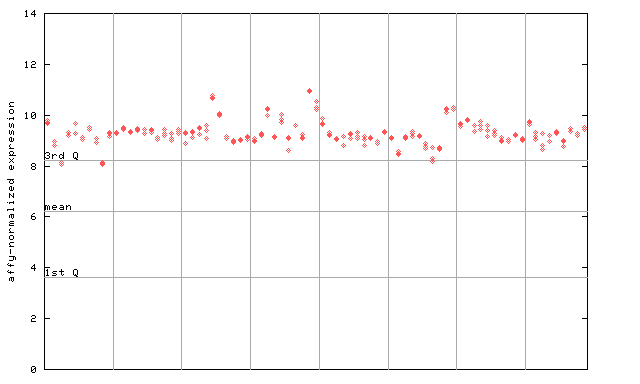
| AtGenExpress* (Stress) |
257687_at
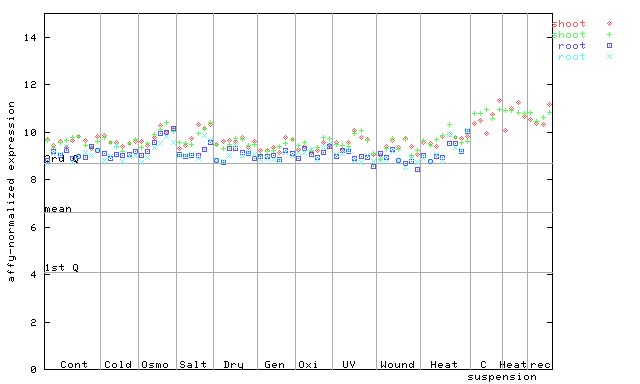
X axis is samples (pdf file), and Y axis is log2-expression. |
|||||||||||||||||||||||||||||||||||||||||||||
| AtGenExpress* (Hormone) |
257687_at
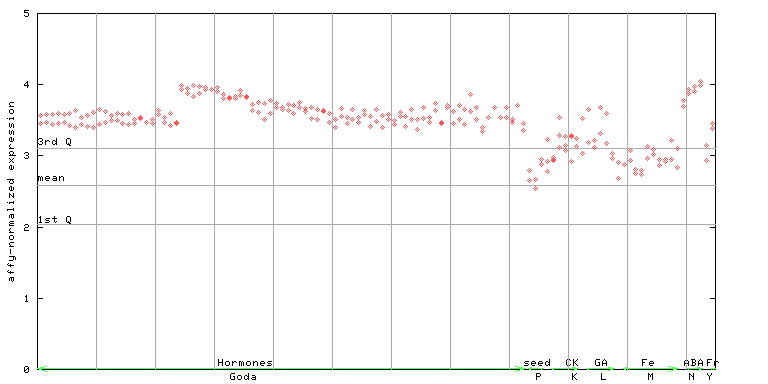
X axis is samples (xls file), and Y axis is log-expression. |
|||||||||||||||||||||||||||||||||||||||||||||


")
")
")
")
| Link to other DBs | ||
| Entrez Gene ID | 820462 |
|
| Refseq ID (protein) | NP_187886.2 | |
The preparation time of this page was 0.2 [sec].