[←][→] ath
| functional annotation | ||||||||||||||||||||||||||
| Function | transmembrane protein |


|
||||||||||||||||||||||||
| GO BP |
|
|||||||||||||||||||||||||
| GO CC |
|
|||||||||||||||||||||||||
| GO MF |
|
|||||||||||||||||||||||||
| KEGG | ||||||||||||||||||||||||||
| Protein | NP_001030719.1 NP_001325514.1 NP_188422.1 | |||||||||||||||||||||||||
| BLAST | NP_001030719.1 NP_001325514.1 NP_188422.1 | |||||||||||||||||||||||||
| Orthologous | [Ortholog page] LOC4330638 (osa) LOC4340678 (osa) LOC7462509 (ppo) LOC7486718 (ppo) LOC11416158 (mtr) LOC100257806 (vvi) LOC100277475 (zma) LOC100278058 (zma) LOC100778596 (gma) LOC100780511 (gma) LOC101260919 (sly) LOC102665927 (gma) LOC103838891 (bra) LOC103859734 (bra) | |||||||||||||||||||||||||
| Subcellular localization wolf |
|
|||||||||||||||||||||||||
| Subcellular localization TargetP |
|
|||||||||||||||||||||||||
| Gene coexpression | ||||||||||||||||||||||||||
| Network*for coexpressed genes |
|
|||||||||||||||||||||||||
|---|---|---|---|---|---|---|---|---|---|---|---|---|---|---|---|---|---|---|---|---|---|---|---|---|---|---|
| Coexpressed gene list |
[Coexpressed gene list for AT3G17950] | |||||||||||||||||||||||||
| Gene expression | ||||||||||||||||||||||||||
| All samples | [Expression pattern for all samples] | |||||||||||||||||||||||||
| AtGenExpress* (Development) |
258213_at
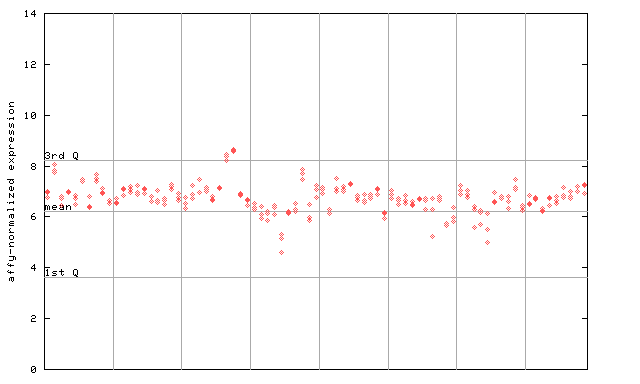
X axis is samples (pdf file), and Y axis is log2-expression. |
|||||||||||||||||||||||||
| AtGenExpress* (Stress) |
258213_at
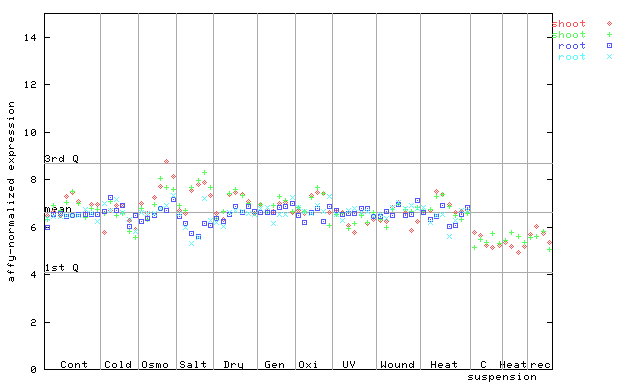
X axis is samples (pdf file), and Y axis is log2-expression. |
|||||||||||||||||||||||||
| AtGenExpress* (Hormone) |
258213_at
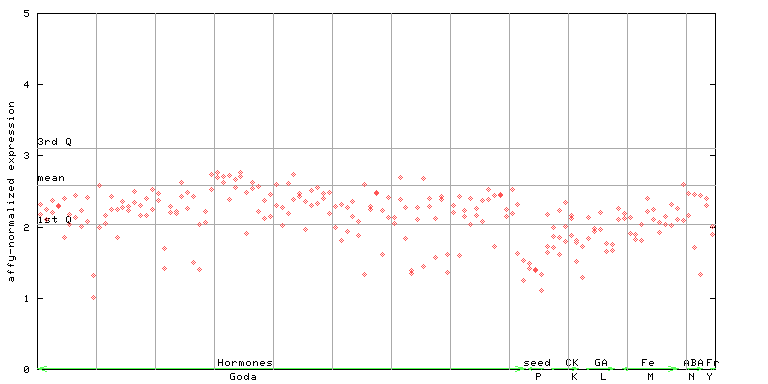
X axis is samples (xls file), and Y axis is log-expression. |
|||||||||||||||||||||||||


| Link to other DBs | ||
| Entrez Gene ID | 820807 |
|
| Refseq ID (protein) | NP_001030719.1 | |
| NP_001325514.1 | |
|
| NP_188422.1 | |
|
The preparation time of this page was 0.2 [sec].