[←][→] ath
| functional annotation | |||||||||||||||||||||||||||||||||||||||||||||||||
| Function | Peptidase S24/S26A/S26B/S26C family protein |


|
|||||||||||||||||||||||||||||||||||||||||||||||
| GO BP |
|
||||||||||||||||||||||||||||||||||||||||||||||||
| GO CC |
|
||||||||||||||||||||||||||||||||||||||||||||||||
| GO MF |
|
||||||||||||||||||||||||||||||||||||||||||||||||
| KEGG | ath03060 [list] [network] Protein export (54 genes) |  |
|||||||||||||||||||||||||||||||||||||||||||||||
| Protein | NP_566523.1 | ||||||||||||||||||||||||||||||||||||||||||||||||
| BLAST | NP_566523.1 | ||||||||||||||||||||||||||||||||||||||||||||||||
| Orthologous | |||||||||||||||||||||||||||||||||||||||||||||||||
| Subcellular localization wolf |
|
||||||||||||||||||||||||||||||||||||||||||||||||
| Subcellular localization TargetP |
|
||||||||||||||||||||||||||||||||||||||||||||||||
| Gene coexpression | |||||||||||||||||||||||||||||||||||||||||||||||||
| Network*for coexpressed genes |
|
||||||||||||||||||||||||||||||||||||||||||||||||
|---|---|---|---|---|---|---|---|---|---|---|---|---|---|---|---|---|---|---|---|---|---|---|---|---|---|---|---|---|---|---|---|---|---|---|---|---|---|---|---|---|---|---|---|---|---|---|---|---|---|
| Coexpressed gene list |
[Coexpressed gene list for AT3G15710] | ||||||||||||||||||||||||||||||||||||||||||||||||
| Gene expression | |||||||||||||||||||||||||||||||||||||||||||||||||
| All samples | [Expression pattern for all samples] | ||||||||||||||||||||||||||||||||||||||||||||||||
| AtGenExpress* (Development) |
258276_at
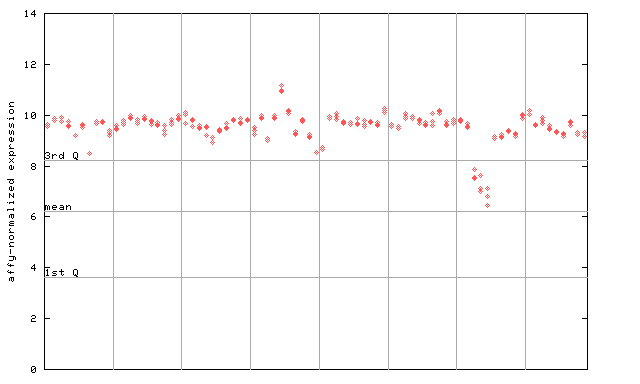
X axis is samples (pdf file), and Y axis is log2-expression. |
||||||||||||||||||||||||||||||||||||||||||||||||
| AtGenExpress* (Stress) |
258276_at
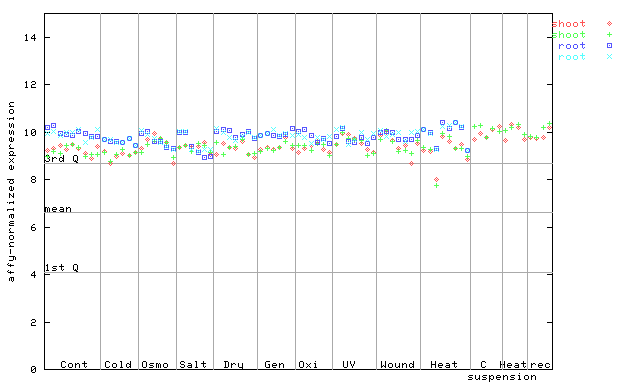
X axis is samples (pdf file), and Y axis is log2-expression. |
||||||||||||||||||||||||||||||||||||||||||||||||
| AtGenExpress* (Hormone) |
258276_at
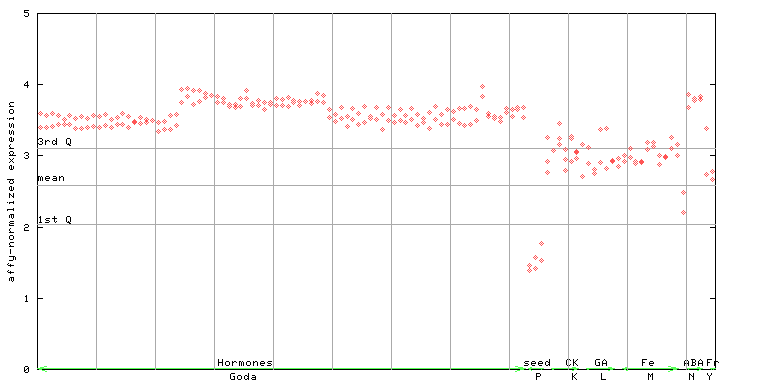
X axis is samples (xls file), and Y axis is log-expression. |
||||||||||||||||||||||||||||||||||||||||||||||||


")
| Link to other DBs | ||
| Entrez Gene ID | 820814 |
|
| Refseq ID (protein) | NP_566523.1 | |
The preparation time of this page was 0.2 [sec].