[←][→] ath
| functional annotation | |||||||||||||||||||||||||||||||||||||||
| Function | calmodulin-binding transcription activator |


|
|||||||||||||||||||||||||||||||||||||
| GO BP |
|
||||||||||||||||||||||||||||||||||||||
| GO CC |
|
||||||||||||||||||||||||||||||||||||||
| GO MF |
|
||||||||||||||||||||||||||||||||||||||
| KEGG | |||||||||||||||||||||||||||||||||||||||
| Protein | NP_001327322.1 NP_001327323.1 NP_188319.2 | ||||||||||||||||||||||||||||||||||||||
| BLAST | NP_001327322.1 NP_001327323.1 NP_188319.2 | ||||||||||||||||||||||||||||||||||||||
| Orthologous | [Ortholog page] LOC4343265 (osa) LOC7482265 (ppo) LOC11413919 (mtr) LOC11427895 (mtr) LOC100243111 (vvi) LOC100502366 (zma) LOC100776839 (gma) LOC100793970 (gma) LOC100807130 (gma) LOC100819198 (gma) SR3L (sly) LOC101055610 (sly) LOC103833552 (bra) LOC103869726 (bra) | ||||||||||||||||||||||||||||||||||||||
| Subcellular localization wolf |
|
||||||||||||||||||||||||||||||||||||||
| Subcellular localization TargetP |
|
||||||||||||||||||||||||||||||||||||||
| Gene coexpression | |||||||||||||||||||||||||||||||||||||||
| Network*for coexpressed genes |
|
||||||||||||||||||||||||||||||||||||||
|---|---|---|---|---|---|---|---|---|---|---|---|---|---|---|---|---|---|---|---|---|---|---|---|---|---|---|---|---|---|---|---|---|---|---|---|---|---|---|---|
| Coexpressed gene list |
[Coexpressed gene list for AT3G16940] | ||||||||||||||||||||||||||||||||||||||
| Gene expression | |||||||||||||||||||||||||||||||||||||||
| All samples | [Expression pattern for all samples] | ||||||||||||||||||||||||||||||||||||||
| AtGenExpress* (Development) |
257883_at
X axis is samples (pdf file), and Y axis is log2-expression. |
||||||||||||||||||||||||||||||||||||||
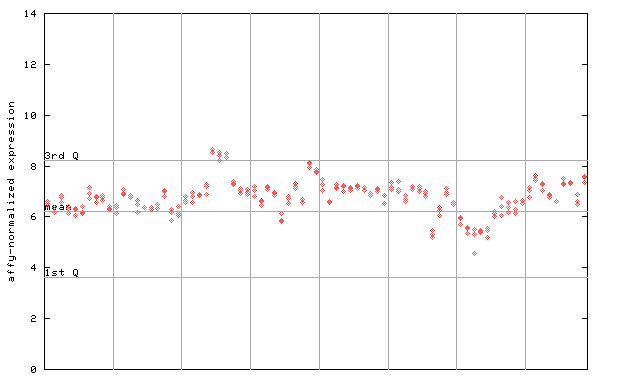
| AtGenExpress* (Stress) |
257883_at
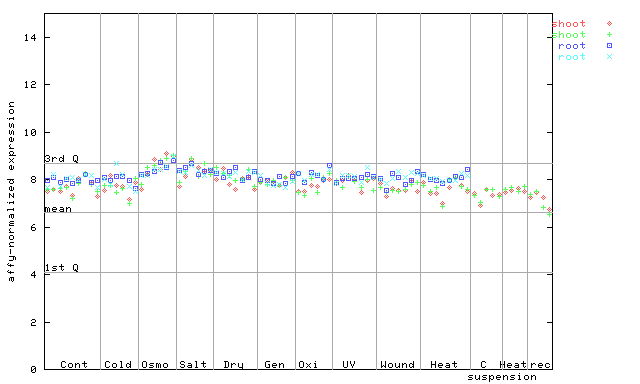
X axis is samples (pdf file), and Y axis is log2-expression. |
||||||||||||||||||||||||||||||||||||||
| AtGenExpress* (Hormone) |
257883_at
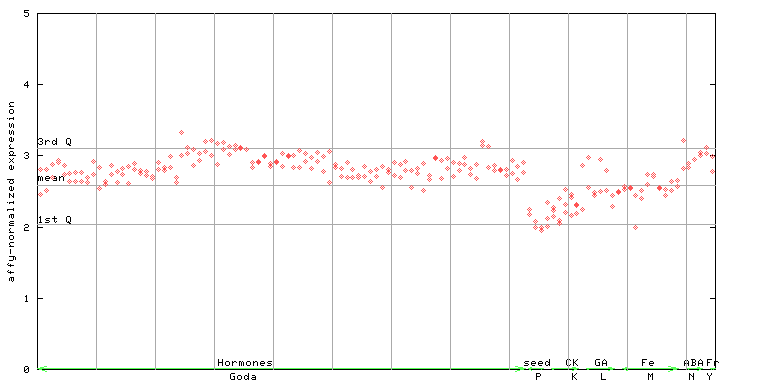
X axis is samples (xls file), and Y axis is log-expression. |
||||||||||||||||||||||||||||||||||||||


")
| Link to other DBs | ||
| Entrez Gene ID | 820950 |
|
| Refseq ID (protein) | NP_001327322.1 | |
| NP_001327323.1 | |
|
| NP_188319.2 | |
|
The preparation time of this page was 0.2 [sec].