[←][→] ath
| functional annotation | ||||||||||||||||||||||||||
| Function | Ca2+-activated RelA/spot-like protein |


|
||||||||||||||||||||||||
| GO BP |
|
|||||||||||||||||||||||||
| GO CC |
|
|||||||||||||||||||||||||
| GO MF |
|
|||||||||||||||||||||||||
| KEGG | ath00230 [list] [network] Purine metabolism (100 genes) |  |
||||||||||||||||||||||||
| Protein | NP_001327078.1 NP_001327079.1 NP_188374.2 | |||||||||||||||||||||||||
| BLAST | NP_001327078.1 NP_001327079.1 NP_188374.2 | |||||||||||||||||||||||||
| Orthologous | [Ortholog page] LOC4337888 (osa) LOC7477201 (ppo) LOC11428310 (mtr) LOC100263094 (vvi) LOC100273011 (zma) LOC100778006 (gma) LOC101250287 (sly) LOC103859710 (bra) | |||||||||||||||||||||||||
| Subcellular localization wolf |
|
|||||||||||||||||||||||||
| Subcellular localization TargetP |
|
|||||||||||||||||||||||||
| Gene coexpression | ||||||||||||||||||||||||||
| Network*for coexpressed genes |
|
|||||||||||||||||||||||||
|---|---|---|---|---|---|---|---|---|---|---|---|---|---|---|---|---|---|---|---|---|---|---|---|---|---|---|
| Coexpressed gene list |
[Coexpressed gene list for CRSH] | |||||||||||||||||||||||||
| Gene expression | ||||||||||||||||||||||||||
| All samples | [Expression pattern for all samples] | |||||||||||||||||||||||||
| AtGenExpress* (Development) |
258375_at
X axis is samples (pdf file), and Y axis is log2-expression. |
|||||||||||||||||||||||||
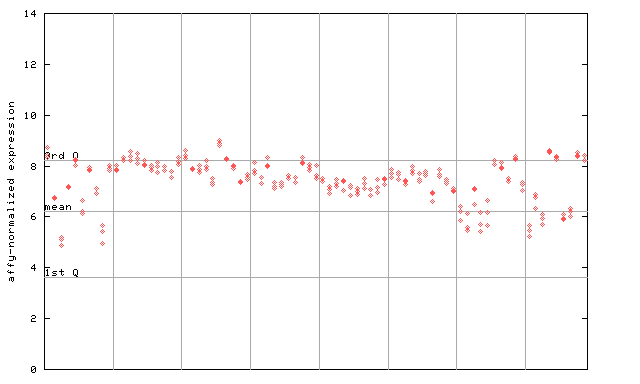
| AtGenExpress* (Stress) |
258375_at
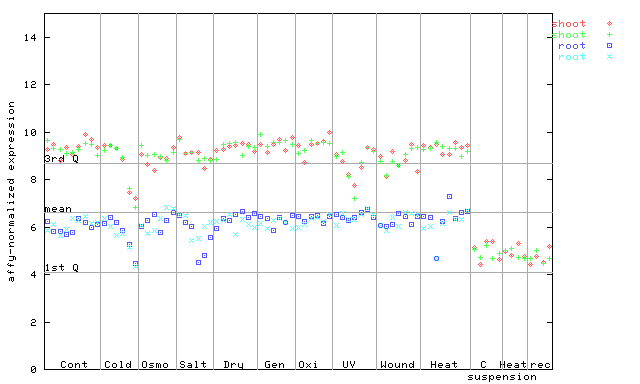
X axis is samples (pdf file), and Y axis is log2-expression. |
|||||||||||||||||||||||||
| AtGenExpress* (Hormone) |
258375_at
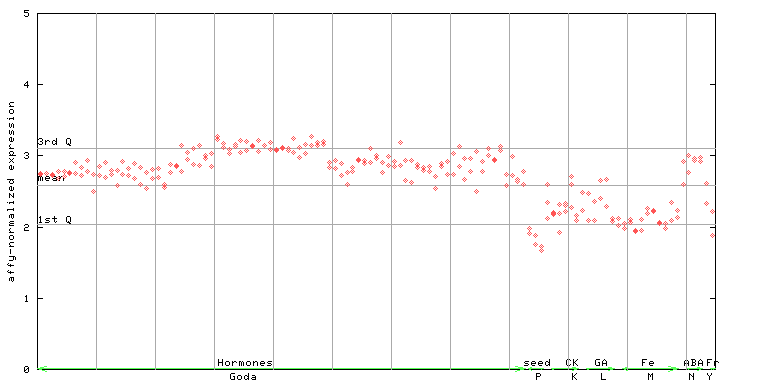
X axis is samples (xls file), and Y axis is log-expression. |
|||||||||||||||||||||||||


| Link to other DBs | ||
| Entrez Gene ID | 821012 |
|
| Refseq ID (protein) | NP_001327078.1 | |
| NP_001327079.1 | |
|
| NP_188374.2 | |
|
The preparation time of this page was 0.2 [sec].