[←][→] ath
| functional annotation | ||||||||||||||||||||||||||||||||||||||||||||||||||||||
| Function | EF hand calcium-binding protein family |


|
||||||||||||||||||||||||||||||||||||||||||||||||||||
| GO BP |
|
|||||||||||||||||||||||||||||||||||||||||||||||||||||
| GO CC |
|
|||||||||||||||||||||||||||||||||||||||||||||||||||||
| GO MF |
|
|||||||||||||||||||||||||||||||||||||||||||||||||||||
| KEGG | ath04626 [list] [network] Plant-pathogen interaction (170 genes) |  |
||||||||||||||||||||||||||||||||||||||||||||||||||||
| Protein | NP_186950.1 | |||||||||||||||||||||||||||||||||||||||||||||||||||||
| BLAST | NP_186950.1 | |||||||||||||||||||||||||||||||||||||||||||||||||||||
| Orthologous | [Ortholog page] AT1G32250 (ath) LOC4324037 (osa) LOC7456089 (ppo) LOC11444791 (mtr) LOC100241974 (vvi) LOC100266587 (vvi) LOC100286292 (zma) LOC100820547 (gma) LOC101244797 (sly) LOC101267979 (sly) LOC103843962 (bra) LOC103847758 (bra) | |||||||||||||||||||||||||||||||||||||||||||||||||||||
| Subcellular localization wolf |
|
|||||||||||||||||||||||||||||||||||||||||||||||||||||
| Subcellular localization TargetP |
|
|||||||||||||||||||||||||||||||||||||||||||||||||||||
| Gene coexpression | ||||||||||||||||||||||||||||||||||||||||||||||||||||||
| Network*for coexpressed genes |
|
|||||||||||||||||||||||||||||||||||||||||||||||||||||
|---|---|---|---|---|---|---|---|---|---|---|---|---|---|---|---|---|---|---|---|---|---|---|---|---|---|---|---|---|---|---|---|---|---|---|---|---|---|---|---|---|---|---|---|---|---|---|---|---|---|---|---|---|---|---|
| Coexpressed gene list |
[Coexpressed gene list for AT3G03000] | |||||||||||||||||||||||||||||||||||||||||||||||||||||
| Gene expression | ||||||||||||||||||||||||||||||||||||||||||||||||||||||
| All samples | [Expression pattern for all samples] | |||||||||||||||||||||||||||||||||||||||||||||||||||||
| AtGenExpress* (Development) |
258617_at
X axis is samples (pdf file), and Y axis is log2-expression. |
|||||||||||||||||||||||||||||||||||||||||||||||||||||
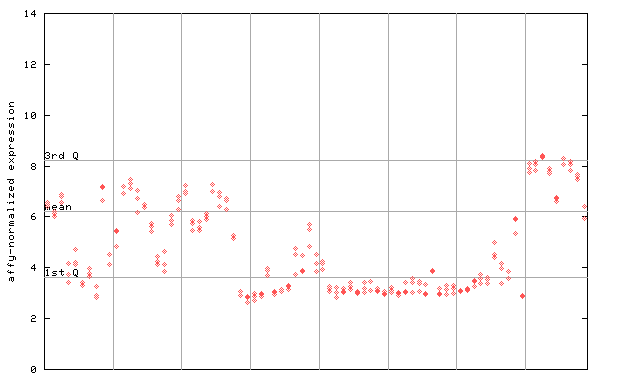
| AtGenExpress* (Stress) |
258617_at
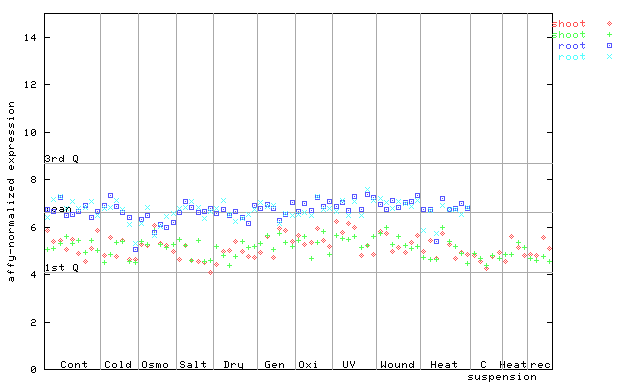
X axis is samples (pdf file), and Y axis is log2-expression. |
|||||||||||||||||||||||||||||||||||||||||||||||||||||
| AtGenExpress* (Hormone) |
258617_at
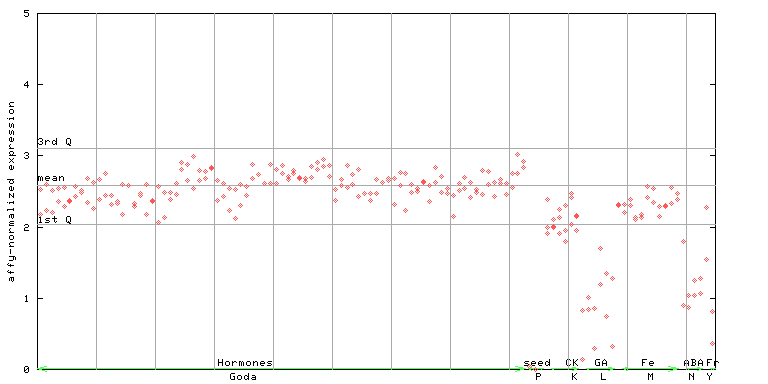
X axis is samples (xls file), and Y axis is log-expression. |
|||||||||||||||||||||||||||||||||||||||||||||||||||||


")
| Link to other DBs | ||
| Entrez Gene ID | 821161 |
|
| Refseq ID (protein) | NP_186950.1 | |
The preparation time of this page was 0.2 [sec].