[←][→] ath
| functional annotation | ||||||||||
| Function | Ribosomal L18p/L5e family protein |


|
||||||||
| GO BP |
|
|||||||||
| GO CC |
|
|||||||||
| GO MF |
|
|||||||||
| KEGG | ath03010 [list] [network] Ribosome (356 genes) |  |
||||||||
| Protein | NP_001319618.1 NP_188884.1 | |||||||||
| BLAST | NP_001319618.1 NP_188884.1 | |||||||||
| Orthologous | [Ortholog page] LOC4348935 (osa) LOC11441089 (mtr) LOC100249372 (vvi) LOC100277147 (zma) LOC100802391 (gma) LOC100813710 (gma) LOC101254165 (sly) LOC103834523 (bra) | |||||||||
| Subcellular localization wolf |
|
|||||||||
| Subcellular localization TargetP |
|
|||||||||
| Gene coexpression | ||||||||||
| Network*for coexpressed genes |
||||||||||
|---|---|---|---|---|---|---|---|---|---|---|
| Coexpressed gene list |
[Coexpressed gene list for AT3G22450] | |||||||||
| Gene expression | ||||||||||
| All samples | [Expression pattern for all samples] | |||||||||
| AtGenExpress* (Development) |
258447_at
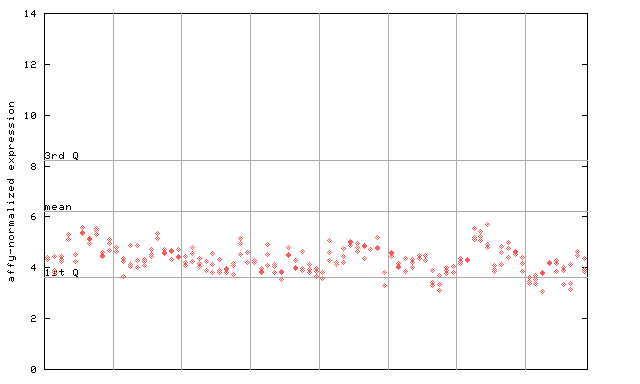
X axis is samples (pdf file), and Y axis is log2-expression. |
|||||||||
| AtGenExpress* (Stress) |
258447_at
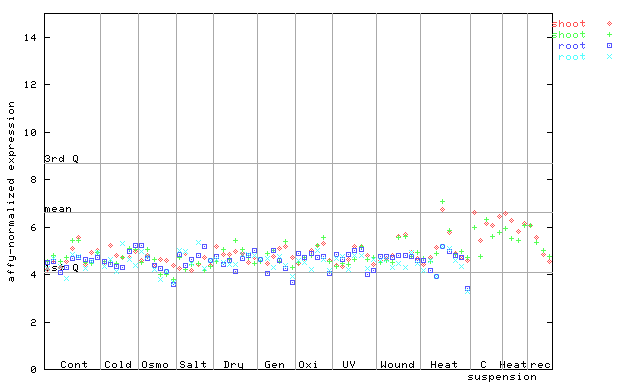
X axis is samples (pdf file), and Y axis is log2-expression. |
|||||||||
| AtGenExpress* (Hormone) |
258447_at
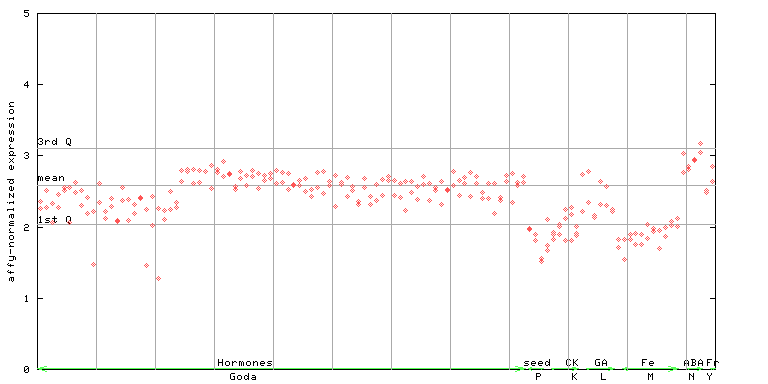
X axis is samples (xls file), and Y axis is log-expression. |
|||||||||

| Link to other DBs | ||
| Entrez Gene ID | 821816 |
|
| Refseq ID (protein) | NP_001319618.1 | |
| NP_188884.1 | |
|
The preparation time of this page was 0.1 [sec].