[←][→] ath
| functional annotation | |||||||||||||||||||||||||||||||||||||||||
| Function | Tetratricopeptide repeat (TPR)-like superfamily protein |


|
|||||||||||||||||||||||||||||||||||||||
| GO BP |
|
||||||||||||||||||||||||||||||||||||||||
| GO CC |
|
||||||||||||||||||||||||||||||||||||||||
| GO MF |
|
||||||||||||||||||||||||||||||||||||||||
| KEGG | |||||||||||||||||||||||||||||||||||||||||
| Protein | NP_001325805.1 NP_188975.3 | ||||||||||||||||||||||||||||||||||||||||
| BLAST | NP_001325805.1 NP_188975.3 | ||||||||||||||||||||||||||||||||||||||||
| Orthologous | [Ortholog page] LOC4343715 (osa) LOC11406568 (mtr) LOC100216998 (zma) LOC100262037 (vvi) LOC100810402 (gma) LOC101254838 (sly) LOC103828751 (bra) | ||||||||||||||||||||||||||||||||||||||||
| Subcellular localization wolf |
|
||||||||||||||||||||||||||||||||||||||||
| Subcellular localization TargetP |
|
||||||||||||||||||||||||||||||||||||||||
| Gene coexpression | |||||||||||||||||||||||||||||||||||||||||
| Network*for coexpressed genes |
|
||||||||||||||||||||||||||||||||||||||||
|---|---|---|---|---|---|---|---|---|---|---|---|---|---|---|---|---|---|---|---|---|---|---|---|---|---|---|---|---|---|---|---|---|---|---|---|---|---|---|---|---|---|
| Coexpressed gene list |
[Coexpressed gene list for AT3G23330] | ||||||||||||||||||||||||||||||||||||||||
| Gene expression | |||||||||||||||||||||||||||||||||||||||||
| All samples | [Expression pattern for all samples] | ||||||||||||||||||||||||||||||||||||||||
| AtGenExpress* (Development) |
258292_at
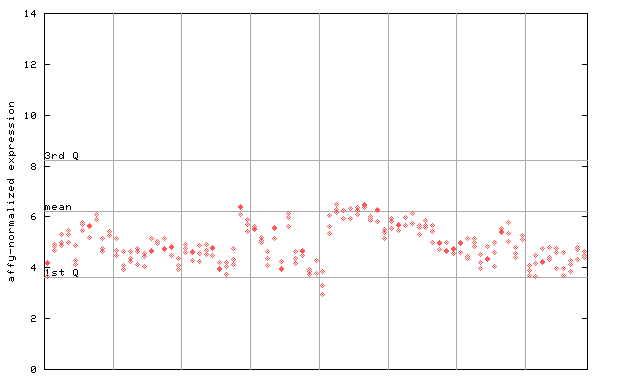
X axis is samples (pdf file), and Y axis is log2-expression. |
||||||||||||||||||||||||||||||||||||||||
| AtGenExpress* (Stress) |
258292_at

X axis is samples (pdf file), and Y axis is log2-expression. |
||||||||||||||||||||||||||||||||||||||||
| AtGenExpress* (Hormone) |
258292_at
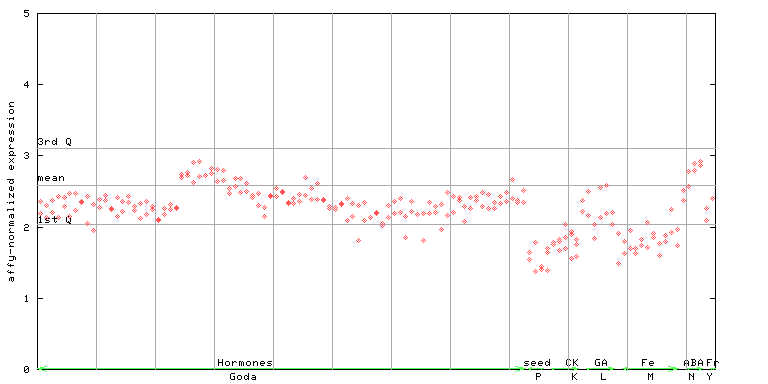
X axis is samples (xls file), and Y axis is log-expression. |
||||||||||||||||||||||||||||||||||||||||


| Link to other DBs | ||
| Entrez Gene ID | 821914 |
|
| Refseq ID (protein) | NP_001325805.1 | |
| NP_188975.3 | |
|
The preparation time of this page was 0.2 [sec].