[←][→] ath
| functional annotation | ||||||||||||||||||||||||||||||||||
| Function | troponin T, skeletal protein |


|
||||||||||||||||||||||||||||||||
| GO BP |
|
|||||||||||||||||||||||||||||||||
| GO CC |
|
|||||||||||||||||||||||||||||||||
| GO MF |
|
|||||||||||||||||||||||||||||||||
| KEGG | ||||||||||||||||||||||||||||||||||
| Protein | NP_189035.1 | |||||||||||||||||||||||||||||||||
| BLAST | NP_189035.1 | |||||||||||||||||||||||||||||||||
| Orthologous | [Ortholog page] AT4G13540 (ath) LOC7477014 (ppo) LOC7494765 (ppo) LOC25483033 (mtr) LOC100244150 (vvi) LOC100306230 (gma) LOC100804745 (gma) LOC100815580 (gma) LOC101265866 (sly) LOC101267009 (sly) LOC103828654 (bra) LOC103863625 (bra) | |||||||||||||||||||||||||||||||||
| Subcellular localization wolf |
|
|||||||||||||||||||||||||||||||||
| Subcellular localization TargetP |
|
|||||||||||||||||||||||||||||||||
| Gene coexpression | ||||||||||||||||||||||||||||||||||
| Network*for coexpressed genes |
|
|||||||||||||||||||||||||||||||||
|---|---|---|---|---|---|---|---|---|---|---|---|---|---|---|---|---|---|---|---|---|---|---|---|---|---|---|---|---|---|---|---|---|---|---|
| Coexpressed gene list |
[Coexpressed gene list for AT3G23930] | |||||||||||||||||||||||||||||||||
| Gene expression | ||||||||||||||||||||||||||||||||||
| All samples | [Expression pattern for all samples] | |||||||||||||||||||||||||||||||||
| AtGenExpress* (Development) |
257567_at
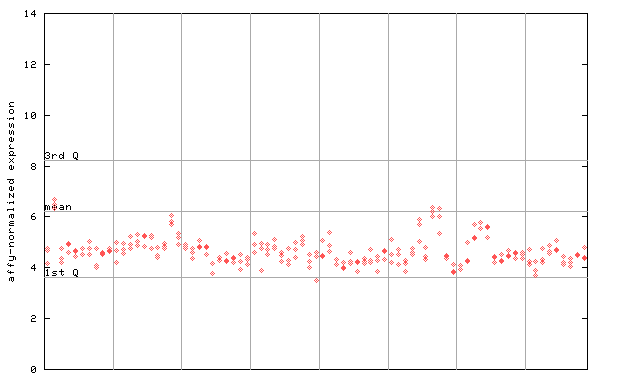
X axis is samples (pdf file), and Y axis is log2-expression. |
|||||||||||||||||||||||||||||||||
| AtGenExpress* (Stress) |
257567_at
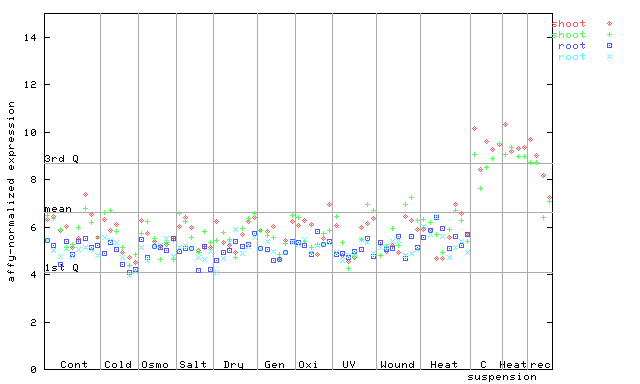
X axis is samples (pdf file), and Y axis is log2-expression. |
|||||||||||||||||||||||||||||||||
| AtGenExpress* (Hormone) |
257567_at
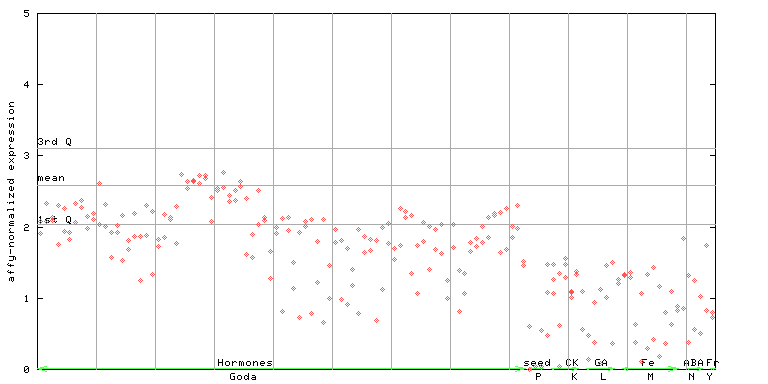
X axis is samples (xls file), and Y axis is log-expression. |
|||||||||||||||||||||||||||||||||


")
| Link to other DBs | ||
| Entrez Gene ID | 821976 |
|
| Refseq ID (protein) | NP_189035.1 | |
The preparation time of this page was 0.1 [sec].