[←][→] ath
| functional annotation | ||||||||||||||||||||||||||||||||||
| Function | TRICHOME BIREFRINGENCE-LIKE 22 |


|
||||||||||||||||||||||||||||||||
| GO BP |
|
|||||||||||||||||||||||||||||||||
| GO CC |
|
|||||||||||||||||||||||||||||||||
| GO MF |
|
|||||||||||||||||||||||||||||||||
| KEGG | ||||||||||||||||||||||||||||||||||
| Protein | NP_189454.1 | |||||||||||||||||||||||||||||||||
| BLAST | NP_189454.1 | |||||||||||||||||||||||||||||||||
| Orthologous | [Ortholog page] LOC4340592 (osa) LOC7454989 (ppo) LOC7495930 (ppo) LOC25495218 (mtr) LOC100257711 (vvi) LOC100795496 (gma) LOC100806002 (gma) LOC101250187 (sly) LOC103629944 (zma) LOC103854204 (bra) LOC103875167 (bra) LOC107278043 (osa) LOC107278309 (osa) | |||||||||||||||||||||||||||||||||
| Subcellular localization wolf |
|
|||||||||||||||||||||||||||||||||
| Subcellular localization TargetP |
|
|||||||||||||||||||||||||||||||||
| Gene coexpression | ||||||||||||||||||||||||||||||||||
| Network*for coexpressed genes |
|
|||||||||||||||||||||||||||||||||
|---|---|---|---|---|---|---|---|---|---|---|---|---|---|---|---|---|---|---|---|---|---|---|---|---|---|---|---|---|---|---|---|---|---|---|
| Coexpressed gene list |
[Coexpressed gene list for TBL22] | |||||||||||||||||||||||||||||||||
| Gene expression | ||||||||||||||||||||||||||||||||||
| All samples | [Expression pattern for all samples] | |||||||||||||||||||||||||||||||||
| AtGenExpress* (Development) |
257309_at
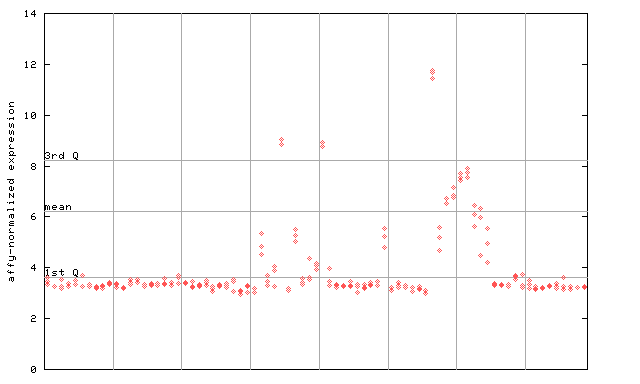
X axis is samples (pdf file), and Y axis is log2-expression. |
|||||||||||||||||||||||||||||||||
| AtGenExpress* (Stress) |
257309_at
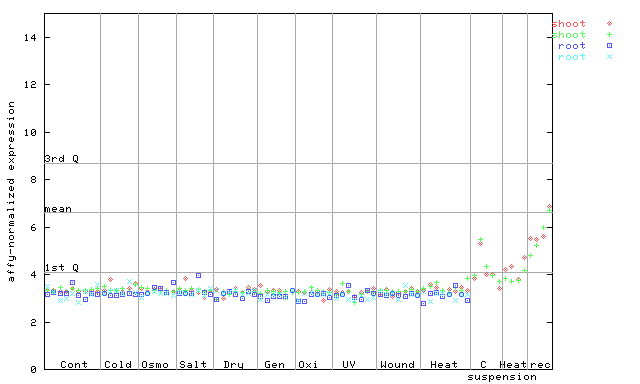
X axis is samples (pdf file), and Y axis is log2-expression. |
|||||||||||||||||||||||||||||||||
| AtGenExpress* (Hormone) |
257309_at
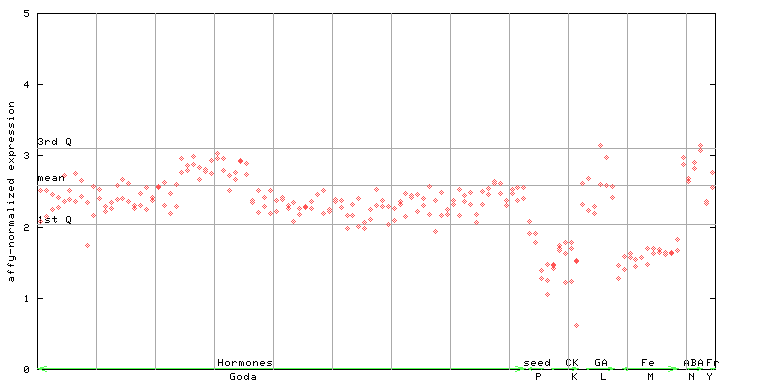
X axis is samples (xls file), and Y axis is log-expression. |
|||||||||||||||||||||||||||||||||


")
| Link to other DBs | ||
| Entrez Gene ID | 822439 |
|
| Refseq ID (protein) | NP_189454.1 | |
The preparation time of this page was 0.2 [sec].