[←][→] ath
| functional annotation | ||||||||||
| Function | P-loop containing nucleoside triphosphate hydrolases superfamily protein |


|
||||||||
| GO BP |
|
|||||||||
| GO CC |
|
|||||||||
| GO MF |
|
|||||||||
| KEGG | ||||||||||
| Protein | NP_189502.2 | |||||||||
| BLAST | NP_189502.2 | |||||||||
| Orthologous | [Ortholog page] AT3G28570 (ath) AT3G28600 (ath) AT5G40000 (ath) LOC101247288 (sly) LOC101247583 (sly) LOC101247884 (sly) LOC103829803 (bra) LOC103837025 (bra) LOC103846781 (bra) LOC103847551 (bra) LOC103850306 (bra) LOC103863934 (bra) LOC103875143 (bra) | |||||||||
| Subcellular localization wolf |
|
|||||||||
| Subcellular localization TargetP |
|
|||||||||
| Gene coexpression | ||||||||||
| Network*for coexpressed genes |
||||||||||
|---|---|---|---|---|---|---|---|---|---|---|
| Coexpressed gene list |
[Coexpressed gene list for AT3G28610] | |||||||||
| Gene expression | ||||||||||
| All samples | [Expression pattern for all samples] | |||||||||
| AtGenExpress* (Development) |
257564_at
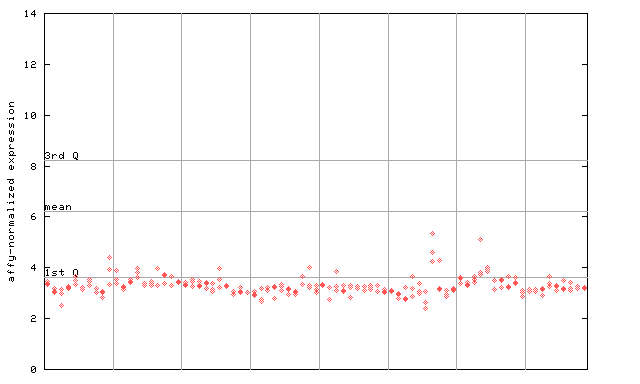
X axis is samples (pdf file), and Y axis is log2-expression. |
|||||||||
| AtGenExpress* (Stress) |
257564_at
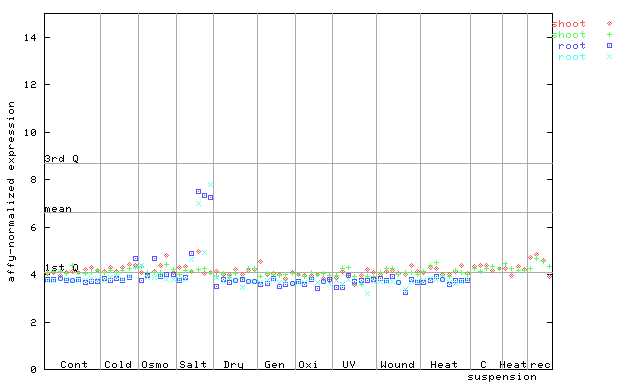
X axis is samples (pdf file), and Y axis is log2-expression. |
|||||||||
| AtGenExpress* (Hormone) |
257564_at
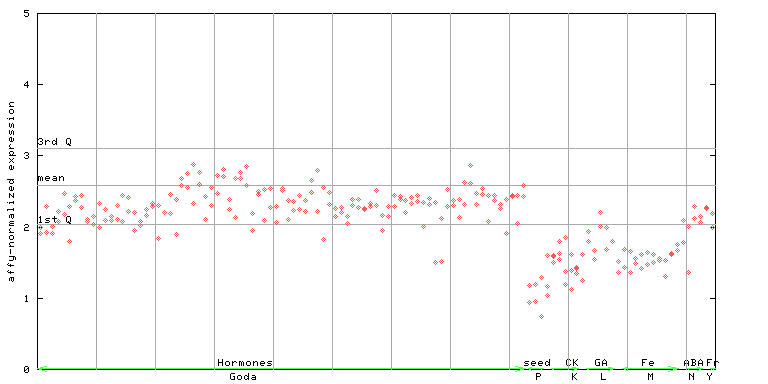
X axis is samples (xls file), and Y axis is log-expression. |
|||||||||

| Link to other DBs | ||
| Entrez Gene ID | 822491 |
|
| Refseq ID (protein) | NP_189502.2 | |
The preparation time of this page was 0.1 [sec].