[←][→] ath
| functional annotation | ||||||||||||||||||||||||||||||||||
| Function | FTSH protease 7 |


|
||||||||||||||||||||||||||||||||
| GO BP |
|
|||||||||||||||||||||||||||||||||
| GO CC |
|
|||||||||||||||||||||||||||||||||
| GO MF |
|
|||||||||||||||||||||||||||||||||
| KEGG | ||||||||||||||||||||||||||||||||||
| Protein | NP_566889.1 | |||||||||||||||||||||||||||||||||
| BLAST | NP_566889.1 | |||||||||||||||||||||||||||||||||
| Orthologous | [Ortholog page] ftsh9 (ath) LOC4330159 (osa) LOC7478548 (ppo) LOC11409380 (mtr) LOC100265577 (vvi) LOC100273697 (zma) LOC100502182 (zma) LOC100787279 (gma) LOC100800195 (gma) LOC101263215 (sly) LOC103845312 (bra) LOC103873267 (bra) | |||||||||||||||||||||||||||||||||
| Subcellular localization wolf |
|
|||||||||||||||||||||||||||||||||
| Subcellular localization TargetP |
|
|||||||||||||||||||||||||||||||||
| Gene coexpression | ||||||||||||||||||||||||||||||||||
| Network*for coexpressed genes |
|
|||||||||||||||||||||||||||||||||
|---|---|---|---|---|---|---|---|---|---|---|---|---|---|---|---|---|---|---|---|---|---|---|---|---|---|---|---|---|---|---|---|---|---|---|
| Coexpressed gene list |
[Coexpressed gene list for ftsh7] | |||||||||||||||||||||||||||||||||
| Gene expression | ||||||||||||||||||||||||||||||||||
| All samples | [Expression pattern for all samples] | |||||||||||||||||||||||||||||||||
| AtGenExpress* (Development) |
252449_at
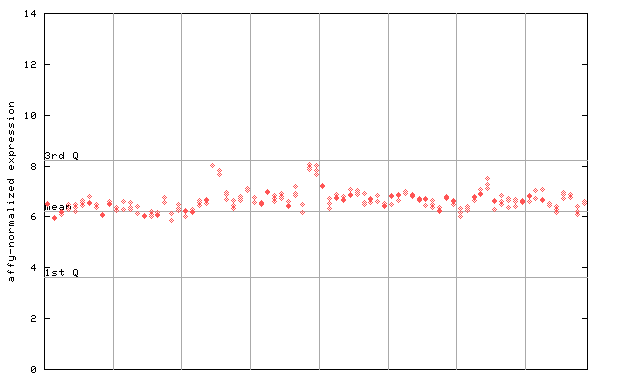
X axis is samples (pdf file), and Y axis is log2-expression. |
|||||||||||||||||||||||||||||||||
| AtGenExpress* (Stress) |
252449_at
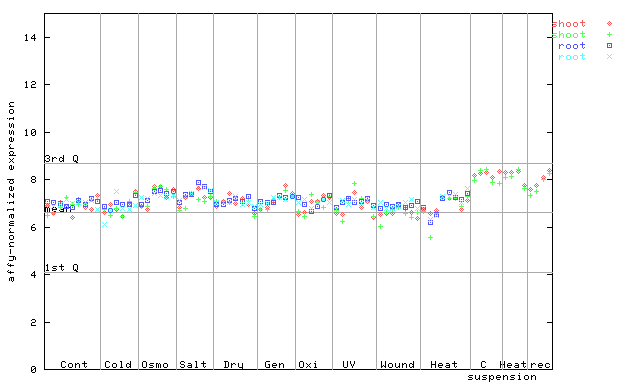
X axis is samples (pdf file), and Y axis is log2-expression. |
|||||||||||||||||||||||||||||||||
| AtGenExpress* (Hormone) |
252449_at
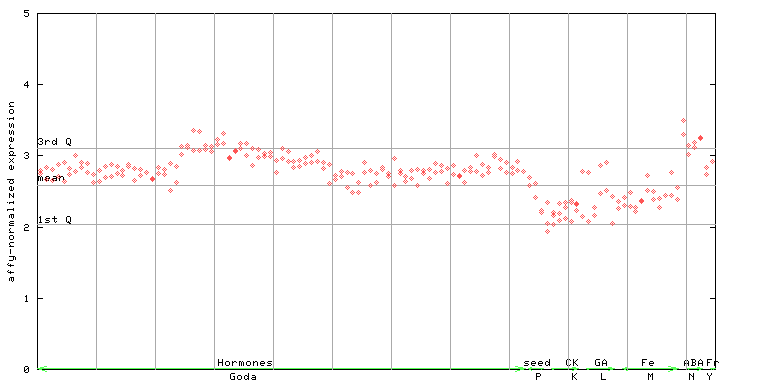
X axis is samples (xls file), and Y axis is log-expression. |
|||||||||||||||||||||||||||||||||


")
| Link to other DBs | ||
| Entrez Gene ID | 823859 |
|
| Refseq ID (protein) | NP_566889.1 | |
The preparation time of this page was 0.2 [sec].