[←][→] ath
| functional annotation | ||||||||||||||||||||||||||||||||||||||
| Function | Ribosomal protein S5 domain 2-like superfamily protein |


|
||||||||||||||||||||||||||||||||||||
| GO BP |
|
|||||||||||||||||||||||||||||||||||||
| GO CC |
|
|||||||||||||||||||||||||||||||||||||
| GO MF |
|
|||||||||||||||||||||||||||||||||||||
| KEGG | ath03010 [list] [network] Ribosome (356 genes) |  |
||||||||||||||||||||||||||||||||||||
| Protein | NP_190477.2 | |||||||||||||||||||||||||||||||||||||
| BLAST | NP_190477.2 | |||||||||||||||||||||||||||||||||||||
| Orthologous | [Ortholog page] LOC4344162 (osa) LOC7484368 (ppo) LOC25489557 (mtr) LOC100246720 (vvi) LOC100796918 (gma) LOC100797241 (gma) LOC101256335 (sly) LOC103643027 (zma) LOC103873089 (bra) | |||||||||||||||||||||||||||||||||||||
| Subcellular localization wolf |
|
|||||||||||||||||||||||||||||||||||||
| Subcellular localization TargetP |
|
|||||||||||||||||||||||||||||||||||||
| Gene coexpression | ||||||||||||||||||||||||||||||||||||||
| Network*for coexpressed genes |
|
|||||||||||||||||||||||||||||||||||||
|---|---|---|---|---|---|---|---|---|---|---|---|---|---|---|---|---|---|---|---|---|---|---|---|---|---|---|---|---|---|---|---|---|---|---|---|---|---|---|
| Coexpressed gene list |
[Coexpressed gene list for AT3G49080] | |||||||||||||||||||||||||||||||||||||
| Gene expression | ||||||||||||||||||||||||||||||||||||||
| All samples | [Expression pattern for all samples] | |||||||||||||||||||||||||||||||||||||
| AtGenExpress* (Development) |
252288_at
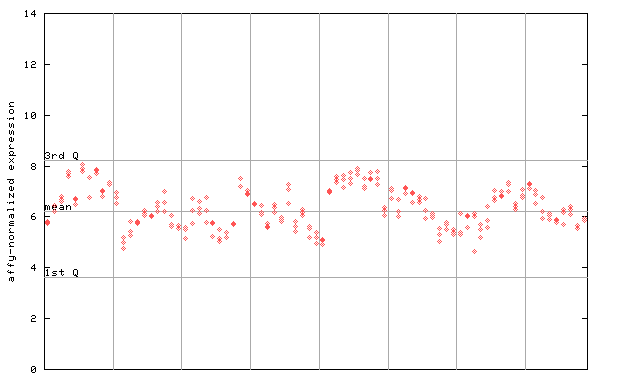
X axis is samples (pdf file), and Y axis is log2-expression. |
|||||||||||||||||||||||||||||||||||||
| AtGenExpress* (Stress) |
252288_at
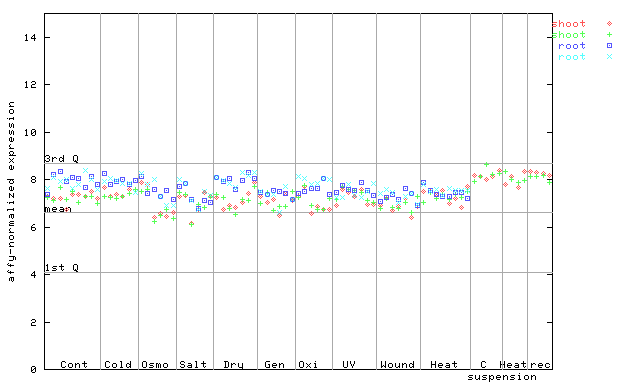
X axis is samples (pdf file), and Y axis is log2-expression. |
|||||||||||||||||||||||||||||||||||||
| AtGenExpress* (Hormone) |
252288_at
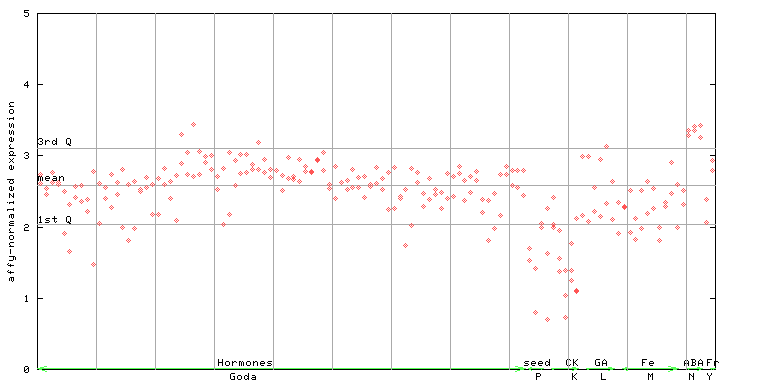
X axis is samples (xls file), and Y axis is log-expression. |
|||||||||||||||||||||||||||||||||||||


")
")
| Link to other DBs | ||
| Entrez Gene ID | 824070 |
|
| Refseq ID (protein) | NP_190477.2 | |
The preparation time of this page was 0.2 [sec].