[←][→] ath
| functional annotation | |||||||||||||||||||||||||||||||||||||||
| Function | protein translocase subunit |


|
|||||||||||||||||||||||||||||||||||||
| GO BP |
|
||||||||||||||||||||||||||||||||||||||
| GO CC |
|
||||||||||||||||||||||||||||||||||||||
| GO MF |
|
||||||||||||||||||||||||||||||||||||||
| KEGG | |||||||||||||||||||||||||||||||||||||||
| Protein | NP_566942.1 | ||||||||||||||||||||||||||||||||||||||
| BLAST | NP_566942.1 | ||||||||||||||||||||||||||||||||||||||
| Orthologous | [Ortholog page] LOC4337680 (osa) LOC7495514 (ppo) LOC11406104 (mtr) LOC100243711 (vvi) LOC100276972 (zma) LOC100305569 (gma) LOC100527226 (gma) LOC100527264 (gma) LOC101247605 (sly) LOC103639698 (zma) LOC103641175 (zma) LOC103841022 (bra) LOC103860685 (bra) | ||||||||||||||||||||||||||||||||||||||
| Subcellular localization wolf |
|
||||||||||||||||||||||||||||||||||||||
| Subcellular localization TargetP |
|
||||||||||||||||||||||||||||||||||||||
| Gene coexpression | |||||||||||||||||||||||||||||||||||||||
| Network*for coexpressed genes |
|
||||||||||||||||||||||||||||||||||||||
|---|---|---|---|---|---|---|---|---|---|---|---|---|---|---|---|---|---|---|---|---|---|---|---|---|---|---|---|---|---|---|---|---|---|---|---|---|---|---|---|
| Coexpressed gene list |
[Coexpressed gene list for AT3G51010] | ||||||||||||||||||||||||||||||||||||||
| Gene expression | |||||||||||||||||||||||||||||||||||||||
| All samples | [Expression pattern for all samples] | ||||||||||||||||||||||||||||||||||||||
| AtGenExpress* (Development) |
252124_at
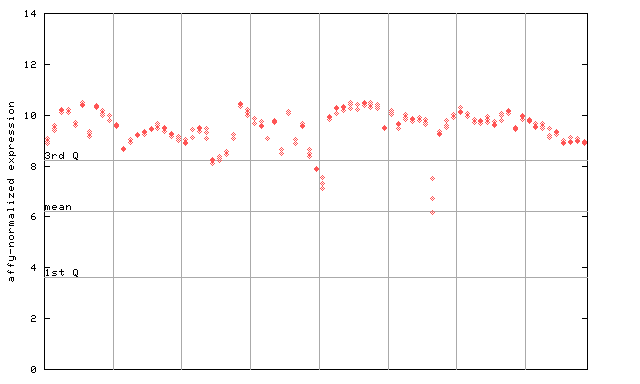
X axis is samples (pdf file), and Y axis is log2-expression. |
||||||||||||||||||||||||||||||||||||||
| AtGenExpress* (Stress) |
252124_at
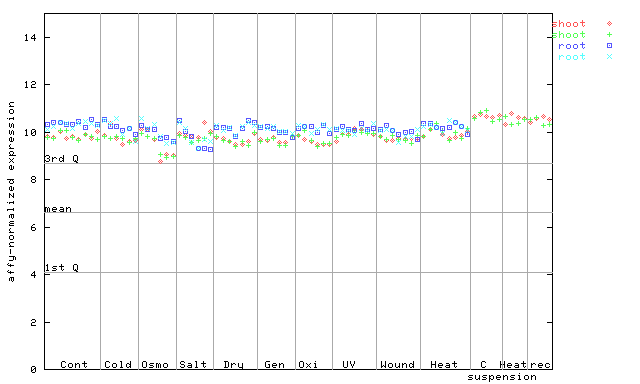
X axis is samples (pdf file), and Y axis is log2-expression. |
||||||||||||||||||||||||||||||||||||||
| AtGenExpress* (Hormone) |
252124_at
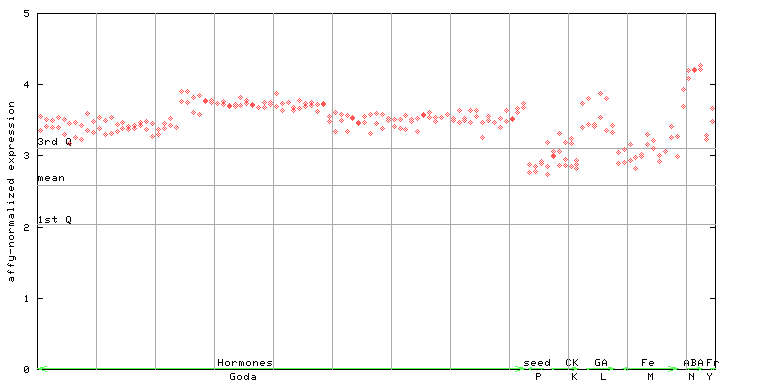
X axis is samples (xls file), and Y axis is log-expression. |
||||||||||||||||||||||||||||||||||||||


")
| Link to other DBs | ||
| Entrez Gene ID | 824265 |
|
| Refseq ID (protein) | NP_566942.1 | |
The preparation time of this page was 0.2 [sec].