[←][→] ath
| functional annotation | ||||||||||||||||||||||||||
| Function | Reticulon family protein |


|
||||||||||||||||||||||||
| GO BP |
|
|||||||||||||||||||||||||
| GO CC |
|
|||||||||||||||||||||||||
| GO MF |
|
|||||||||||||||||||||||||
| KEGG | ||||||||||||||||||||||||||
| Protein | NP_190980.1 | |||||||||||||||||||||||||
| BLAST | NP_190980.1 | |||||||||||||||||||||||||
| Orthologous | [Ortholog page] LOC4335583 (osa) LOC7466040 (ppo) LOC9271780 (osa) LOC11417883 (mtr) LOC100266674 (vvi) LOC100284399 (zma) LOC100775554 (gma) LOC100809125 (gma) LOC101255422 (sly) LOC103651007 (zma) LOC103829965 (bra) LOC103841327 (bra) | |||||||||||||||||||||||||
| Subcellular localization wolf |
|
|||||||||||||||||||||||||
| Subcellular localization TargetP |
|
|||||||||||||||||||||||||
| Gene coexpression | ||||||||||||||||||||||||||
| Network*for coexpressed genes |
|
|||||||||||||||||||||||||
|---|---|---|---|---|---|---|---|---|---|---|---|---|---|---|---|---|---|---|---|---|---|---|---|---|---|---|
| Coexpressed gene list |
[Coexpressed gene list for AT3G54120] | |||||||||||||||||||||||||
| Gene expression | ||||||||||||||||||||||||||
| All samples | [Expression pattern for all samples] | |||||||||||||||||||||||||
| AtGenExpress* (Development) |
251903_at
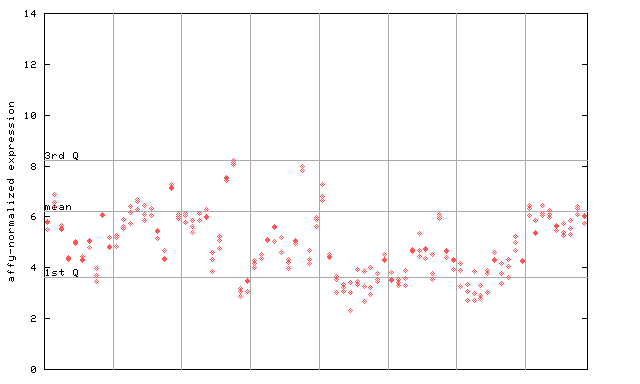
X axis is samples (pdf file), and Y axis is log2-expression. |
|||||||||||||||||||||||||
| AtGenExpress* (Stress) |
251903_at
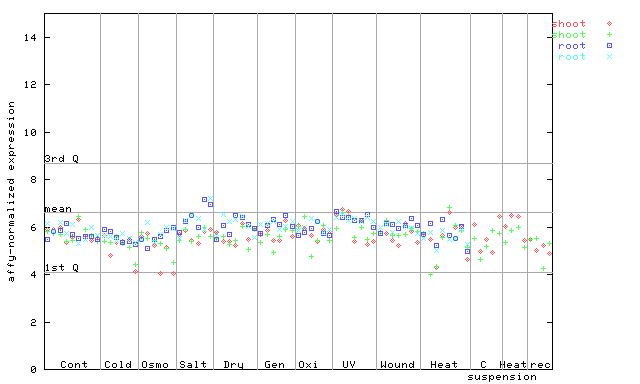
X axis is samples (pdf file), and Y axis is log2-expression. |
|||||||||||||||||||||||||
| AtGenExpress* (Hormone) |
251903_at
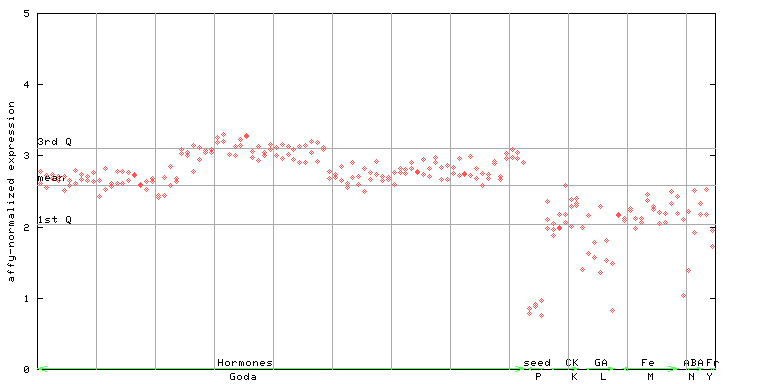
X axis is samples (xls file), and Y axis is log-expression. |
|||||||||||||||||||||||||


| Link to other DBs | ||
| Entrez Gene ID | 824579 |
|
| Refseq ID (protein) | NP_190980.1 | |
The preparation time of this page was 0.1 [sec].