[←][→] ath
| functional annotation | |||||||||||||||||||||||||||||||||||||||||||||||||
| Function | hypothetical protein |


|
|||||||||||||||||||||||||||||||||||||||||||||||
| GO BP |
|
||||||||||||||||||||||||||||||||||||||||||||||||
| GO CC |
|
||||||||||||||||||||||||||||||||||||||||||||||||
| GO MF |
|
||||||||||||||||||||||||||||||||||||||||||||||||
| KEGG | |||||||||||||||||||||||||||||||||||||||||||||||||
| Protein | NP_191644.1 | ||||||||||||||||||||||||||||||||||||||||||||||||
| BLAST | NP_191644.1 | ||||||||||||||||||||||||||||||||||||||||||||||||
| Orthologous | [Ortholog page] LOC4332244 (osa) LOC7464865 (ppo) LOC25501020 (mtr) LOC100254100 (vvi) LOC100275622 (zma) LOC100501154 (zma) LOC100790847 (gma) LOC101254032 (sly) LOC103830274 (bra) LOC103841928 (bra) | ||||||||||||||||||||||||||||||||||||||||||||||||
| Subcellular localization wolf |
|
||||||||||||||||||||||||||||||||||||||||||||||||
| Subcellular localization TargetP |
|
||||||||||||||||||||||||||||||||||||||||||||||||
| Gene coexpression | |||||||||||||||||||||||||||||||||||||||||||||||||
| Network*for coexpressed genes |
|
||||||||||||||||||||||||||||||||||||||||||||||||
|---|---|---|---|---|---|---|---|---|---|---|---|---|---|---|---|---|---|---|---|---|---|---|---|---|---|---|---|---|---|---|---|---|---|---|---|---|---|---|---|---|---|---|---|---|---|---|---|---|---|
| Coexpressed gene list |
[Coexpressed gene list for AT3G60850] | ||||||||||||||||||||||||||||||||||||||||||||||||
| Gene expression | |||||||||||||||||||||||||||||||||||||||||||||||||
| All samples | [Expression pattern for all samples] | ||||||||||||||||||||||||||||||||||||||||||||||||
| AtGenExpress* (Development) |
251389_at
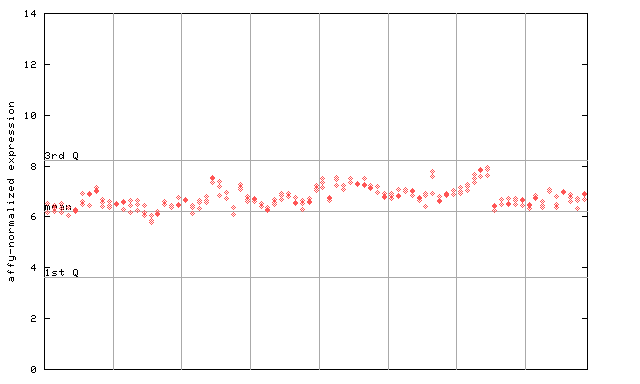
X axis is samples (pdf file), and Y axis is log2-expression. |
||||||||||||||||||||||||||||||||||||||||||||||||
| AtGenExpress* (Stress) |
251389_at
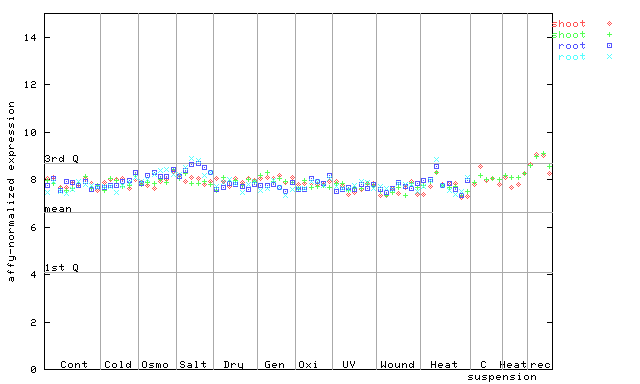
X axis is samples (pdf file), and Y axis is log2-expression. |
||||||||||||||||||||||||||||||||||||||||||||||||
| AtGenExpress* (Hormone) |
251389_at
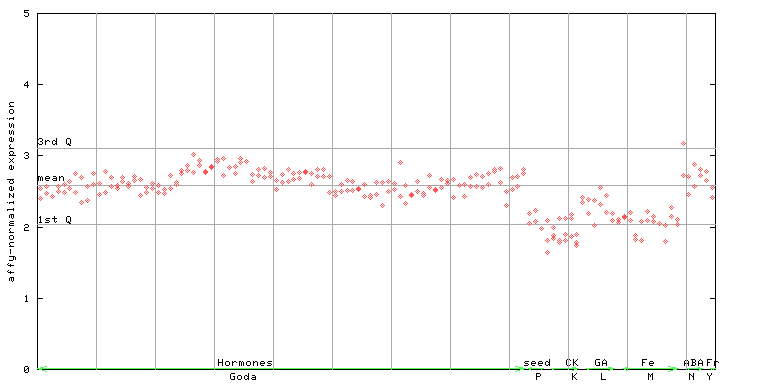
X axis is samples (xls file), and Y axis is log-expression. |
||||||||||||||||||||||||||||||||||||||||||||||||


")
| Link to other DBs | ||
| Entrez Gene ID | 825256 |
|
| Refseq ID (protein) | NP_191644.1 | |
The preparation time of this page was 0.2 [sec].