[←][→] ath
| functional annotation | |||||||||||||||||||||||||||||||||||||||||||||||||||
| Function | Carbohydrate-binding-like fold |


|
|||||||||||||||||||||||||||||||||||||||||||||||||
| GO BP |
|
||||||||||||||||||||||||||||||||||||||||||||||||||
| GO CC |
|
||||||||||||||||||||||||||||||||||||||||||||||||||
| GO MF |
|
||||||||||||||||||||||||||||||||||||||||||||||||||
| KEGG | |||||||||||||||||||||||||||||||||||||||||||||||||||
| Protein | NP_001327489.1 NP_191795.1 | ||||||||||||||||||||||||||||||||||||||||||||||||||
| BLAST | NP_001327489.1 NP_191795.1 | ||||||||||||||||||||||||||||||||||||||||||||||||||
| Orthologous | [Ortholog page] LOC4325779 (osa) LOC11434792 (mtr) LOC100260653 (vvi) LOC100384763 (zma) LOC100794049 (gma) LOC100815384 (gma) LOC101265828 (sly) LOC103842054 (bra) | ||||||||||||||||||||||||||||||||||||||||||||||||||
| Subcellular localization wolf |
|
||||||||||||||||||||||||||||||||||||||||||||||||||
| Subcellular localization TargetP |
|
||||||||||||||||||||||||||||||||||||||||||||||||||
| Gene coexpression | |||||||||||||||||||||||||||||||||||||||||||||||||||
| Network*for coexpressed genes |
|
||||||||||||||||||||||||||||||||||||||||||||||||||
|---|---|---|---|---|---|---|---|---|---|---|---|---|---|---|---|---|---|---|---|---|---|---|---|---|---|---|---|---|---|---|---|---|---|---|---|---|---|---|---|---|---|---|---|---|---|---|---|---|---|---|---|
| Coexpressed gene list |
[Coexpressed gene list for AT3G62360] | ||||||||||||||||||||||||||||||||||||||||||||||||||
| Gene expression | |||||||||||||||||||||||||||||||||||||||||||||||||||
| All samples | [Expression pattern for all samples] | ||||||||||||||||||||||||||||||||||||||||||||||||||
| AtGenExpress* (Development) |
251269_at
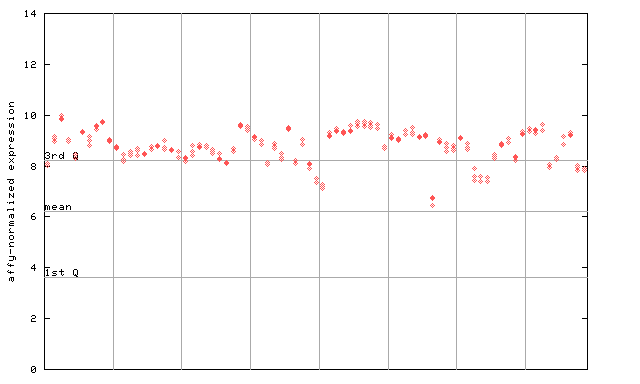
X axis is samples (pdf file), and Y axis is log2-expression. |
||||||||||||||||||||||||||||||||||||||||||||||||||
| AtGenExpress* (Stress) |
251269_at
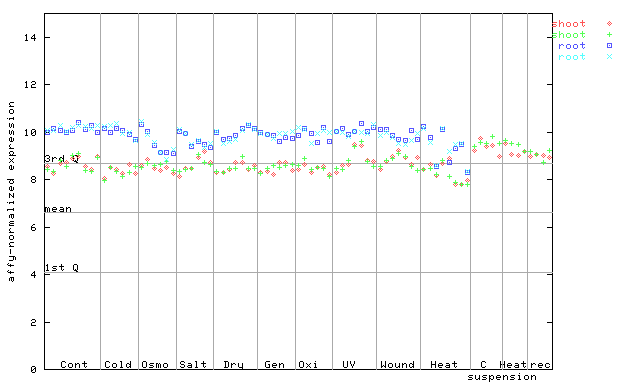
X axis is samples (pdf file), and Y axis is log2-expression. |
||||||||||||||||||||||||||||||||||||||||||||||||||
| AtGenExpress* (Hormone) |
251269_at
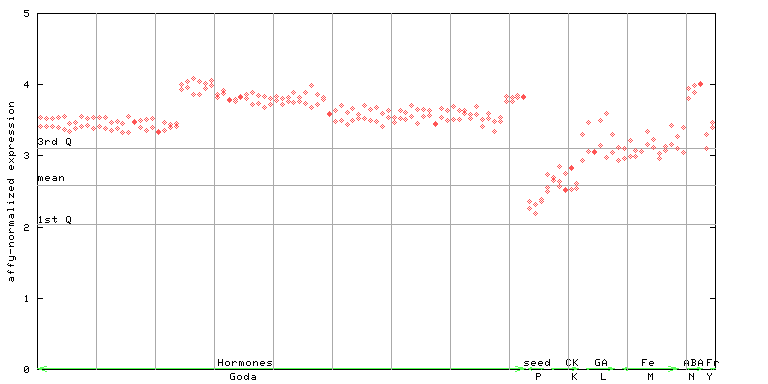
X axis is samples (xls file), and Y axis is log-expression. |
||||||||||||||||||||||||||||||||||||||||||||||||||


")
")
")
")
| Link to other DBs | ||
| Entrez Gene ID | 825409 |
|
| Refseq ID (protein) | NP_001327489.1 | |
| NP_191795.1 | |
|
The preparation time of this page was 0.2 [sec].