[←][→] ath
| functional annotation | ||||||||||||||||||||||||||||||||||||||||||||
| Function | transmembrane protein (DUF616) |


|
||||||||||||||||||||||||||||||||||||||||||
| GO BP |
|
|||||||||||||||||||||||||||||||||||||||||||
| GO CC |
|
|||||||||||||||||||||||||||||||||||||||||||
| GO MF |
|
|||||||||||||||||||||||||||||||||||||||||||
| KEGG | ||||||||||||||||||||||||||||||||||||||||||||
| Protein | NP_001328159.1 NP_192701.1 | |||||||||||||||||||||||||||||||||||||||||||
| BLAST | NP_001328159.1 NP_192701.1 | |||||||||||||||||||||||||||||||||||||||||||
| Orthologous | [Ortholog page] EMB2756 (ath) LOC4349998 (osa) LOC25484964 (mtr) LOC100248770 (vvi) LOC100281466 (zma) LOC100797815 (gma) LOC100810524 (gma) LOC101266589 (sly) LOC103647986 (zma) LOC103833595 (bra) LOC103840004 (bra) | |||||||||||||||||||||||||||||||||||||||||||
| Subcellular localization wolf |
|
|||||||||||||||||||||||||||||||||||||||||||
| Subcellular localization TargetP |
|
|||||||||||||||||||||||||||||||||||||||||||
| Gene coexpression | ||||||||||||||||||||||||||||||||||||||||||||
| Network*for coexpressed genes |
|
|||||||||||||||||||||||||||||||||||||||||||
|---|---|---|---|---|---|---|---|---|---|---|---|---|---|---|---|---|---|---|---|---|---|---|---|---|---|---|---|---|---|---|---|---|---|---|---|---|---|---|---|---|---|---|---|---|
| Coexpressed gene list |
[Coexpressed gene list for AT4G09630] | |||||||||||||||||||||||||||||||||||||||||||
| Gene expression | ||||||||||||||||||||||||||||||||||||||||||||
| All samples | [Expression pattern for all samples] | |||||||||||||||||||||||||||||||||||||||||||
| AtGenExpress* (Development) |
255042_at
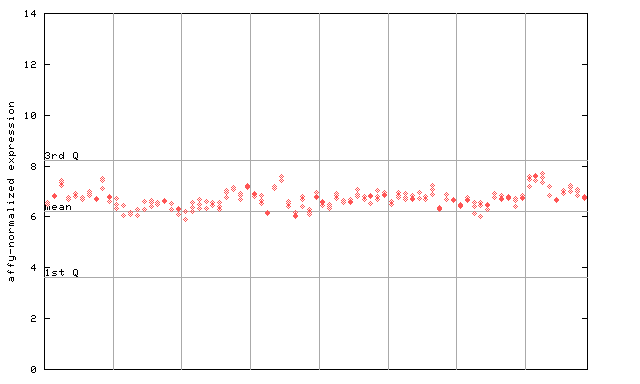
X axis is samples (pdf file), and Y axis is log2-expression. |
|||||||||||||||||||||||||||||||||||||||||||
| AtGenExpress* (Stress) |
255042_at
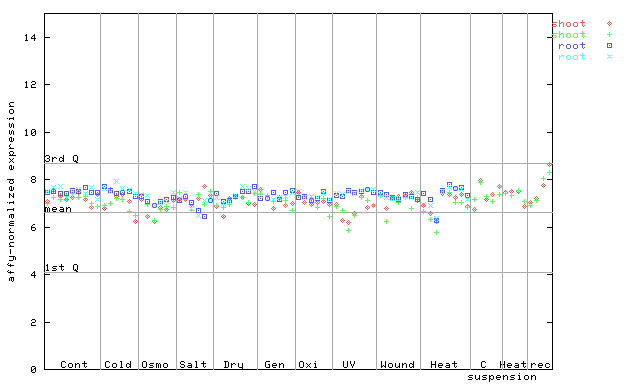
X axis is samples (pdf file), and Y axis is log2-expression. |
|||||||||||||||||||||||||||||||||||||||||||
| AtGenExpress* (Hormone) |
255042_at
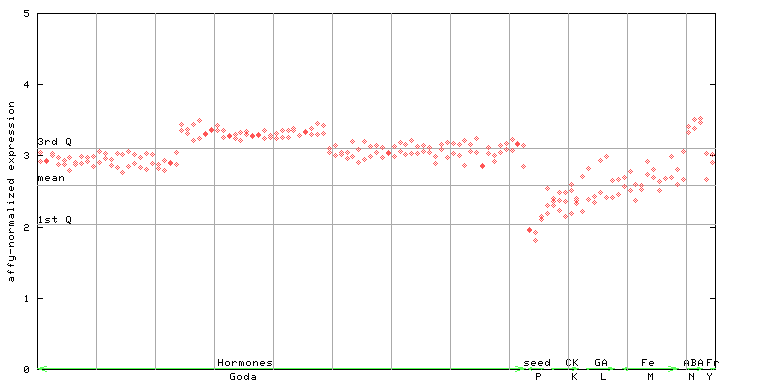
X axis is samples (xls file), and Y axis is log-expression. |
|||||||||||||||||||||||||||||||||||||||||||


")
| Link to other DBs | ||
| Entrez Gene ID | 826549 |
|
| Refseq ID (protein) | NP_001328159.1 | |
| NP_192701.1 | |
|
The preparation time of this page was 0.2 [sec].