[←][→] ath
| functional annotation | ||||||||||
| Function | hydroxysteroid dehydrogenase 5 |


|
||||||||
| GO BP |
|
|||||||||
| GO CC |
|
|||||||||
| GO MF |
|
|||||||||
| KEGG | ||||||||||
| Protein | NP_192740.1 | |||||||||
| BLAST | NP_192740.1 | |||||||||
| Orthologous | [Ortholog page] LOC4334744 (osa) LOC7455255 (ppo) LOC11433732 (mtr) LOC100260124 (vvi) LOC100780731 (gma) LOC101260242 (sly) LOC103858549 (bra) LOC113561368 (zma) | |||||||||
| Subcellular localization wolf |
|
|||||||||
| Subcellular localization TargetP |
|
|||||||||
| Gene coexpression | ||||||||||
| Network*for coexpressed genes |
||||||||||
|---|---|---|---|---|---|---|---|---|---|---|
| Coexpressed gene list |
[Coexpressed gene list for HSD5] | |||||||||
| Gene expression | ||||||||||
| All samples | [Expression pattern for all samples] | |||||||||
| AtGenExpress* (Development) |
255007_at
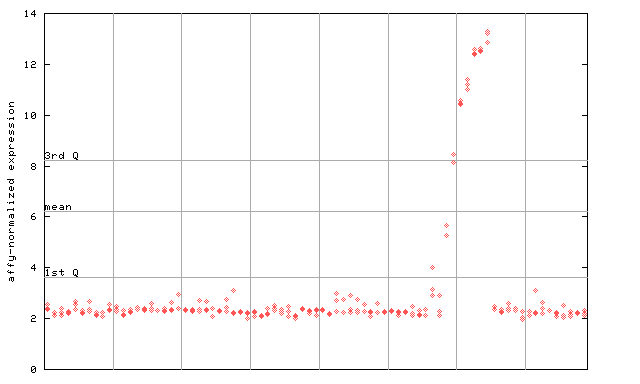
X axis is samples (pdf file), and Y axis is log2-expression. |
|||||||||
| AtGenExpress* (Stress) |
255007_at
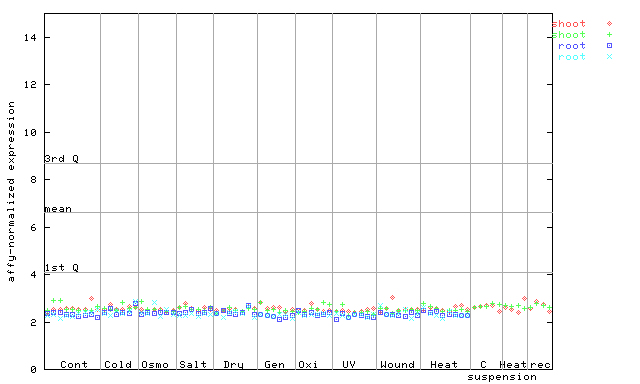
X axis is samples (pdf file), and Y axis is log2-expression. |
|||||||||
| AtGenExpress* (Hormone) |
255007_at
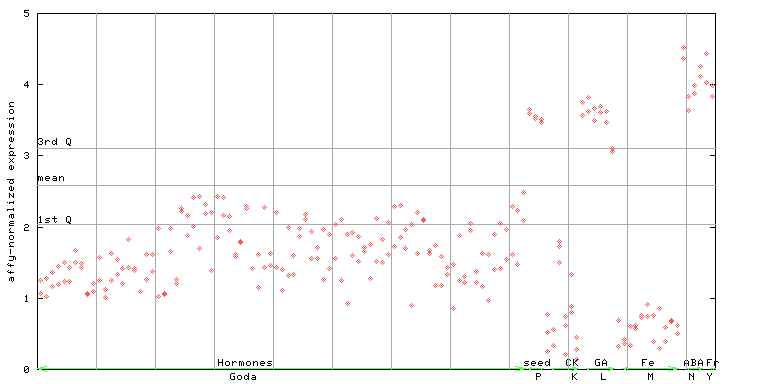
X axis is samples (xls file), and Y axis is log-expression. |
|||||||||


| Link to other DBs | ||
| Entrez Gene ID | 826593 |
|
| Refseq ID (protein) | NP_192740.1 | |
The preparation time of this page was 0.2 [sec].