[←][→] ath
| functional annotation | |||||||||||||||||||||||||||||||
| Function | transmembrane protein |


|
|||||||||||||||||||||||||||||
| GO BP |
|
||||||||||||||||||||||||||||||
| GO CC |
|
||||||||||||||||||||||||||||||
| GO MF |
|
||||||||||||||||||||||||||||||
| KEGG | |||||||||||||||||||||||||||||||
| Protein | NP_567353.1 | ||||||||||||||||||||||||||||||
| BLAST | NP_567353.1 | ||||||||||||||||||||||||||||||
| Orthologous | [Ortholog page] AT1G33490 (ath) LOC4337558 (osa) LOC7483548 (ppo) LOC11418373 (mtr) LOC11432289 (mtr) LOC100192698 (zma) LOC100248177 (vvi) LOC100276348 (zma) LOC100305584 (gma) LOC100500088 (gma) LOC101252894 (sly) LOC101255263 (sly) LOC103838902 (bra) LOC103840058 (bra) LOC103853566 (bra) | ||||||||||||||||||||||||||||||
| Subcellular localization wolf |
|
||||||||||||||||||||||||||||||
| Subcellular localization TargetP |
|
||||||||||||||||||||||||||||||
| Gene coexpression | |||||||||||||||||||||||||||||||
| Network*for coexpressed genes |
|
||||||||||||||||||||||||||||||
|---|---|---|---|---|---|---|---|---|---|---|---|---|---|---|---|---|---|---|---|---|---|---|---|---|---|---|---|---|---|---|---|
| Coexpressed gene list |
[Coexpressed gene list for AT4G10140] | ||||||||||||||||||||||||||||||
| Gene expression | |||||||||||||||||||||||||||||||
| All samples | [Expression pattern for all samples] | ||||||||||||||||||||||||||||||
| AtGenExpress* (Development) |
255810_at
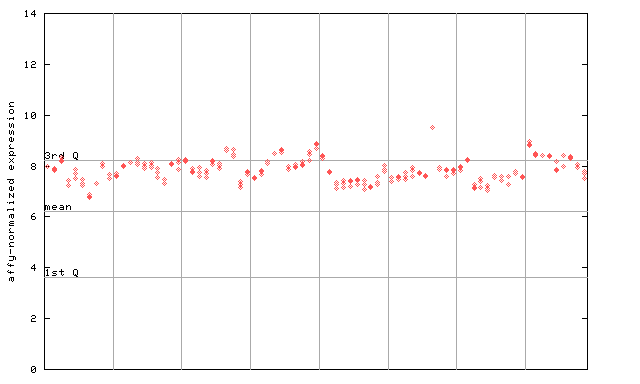
X axis is samples (pdf file), and Y axis is log2-expression. |
||||||||||||||||||||||||||||||
| AtGenExpress* (Stress) |
255810_at
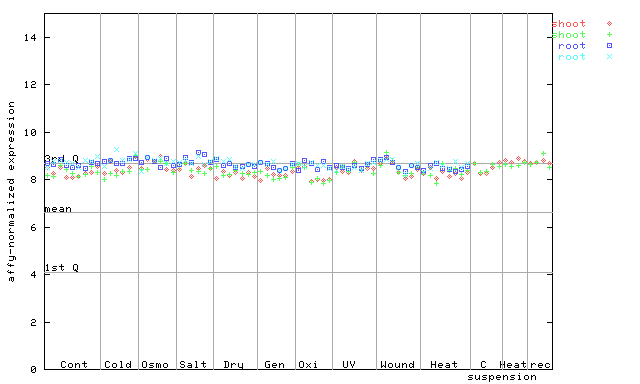
X axis is samples (pdf file), and Y axis is log2-expression. |
||||||||||||||||||||||||||||||
| AtGenExpress* (Hormone) |
255810_at
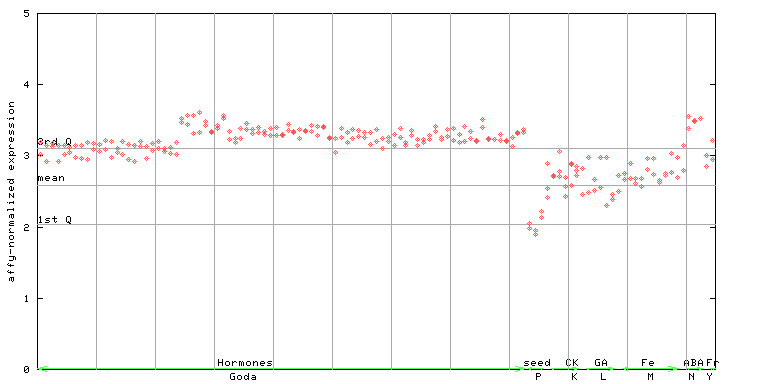
X axis is samples (xls file), and Y axis is log-expression. |
||||||||||||||||||||||||||||||


| Link to other DBs | ||
| Entrez Gene ID | 826605 |
|
| Refseq ID (protein) | NP_567353.1 | |
The preparation time of this page was 0.2 [sec].