[←][→] ath
| functional annotation | ||||||||||||||
| Function | beta-amylase 5 |


|
||||||||||||
| GO BP |
|
|||||||||||||
| GO CC |
|
|||||||||||||
| GO MF |
|
|||||||||||||
| KEGG | ath00500 [list] [network] Starch and sucrose metabolism (165 genes) |  |
||||||||||||
| Protein | NP_001329367.1 NP_001329368.1 NP_567460.1 NP_849389.1 | |||||||||||||
| BLAST | NP_001329367.1 NP_001329368.1 NP_567460.1 NP_849389.1 | |||||||||||||
| Orthologous | [Ortholog page] LOC542472 (zma) BMY1 (gma) BAM6 (ath) LOC4343510 (osa) LOC9267841 (osa) LOC11422644 (mtr) LOC25492017 (mtr) LOC100251739 (vvi) LOC100382206 (zma) LOC100787580 (gma) LOC100807365 (gma) LOC101247340 (sly) LOC103833505 (bra) LOC103867633 (bra) | |||||||||||||
| Subcellular localization wolf |
|
|||||||||||||
| Subcellular localization TargetP |
|
|||||||||||||
| Gene coexpression | ||||||||||||||
| Network*for coexpressed genes |
||||||||||||||
|---|---|---|---|---|---|---|---|---|---|---|---|---|---|---|
| Coexpressed gene list |
[Coexpressed gene list for BAM5] | |||||||||||||
| Gene expression | ||||||||||||||
| All samples | [Expression pattern for all samples] | |||||||||||||
| AtGenExpress* (Development) |
245275_at
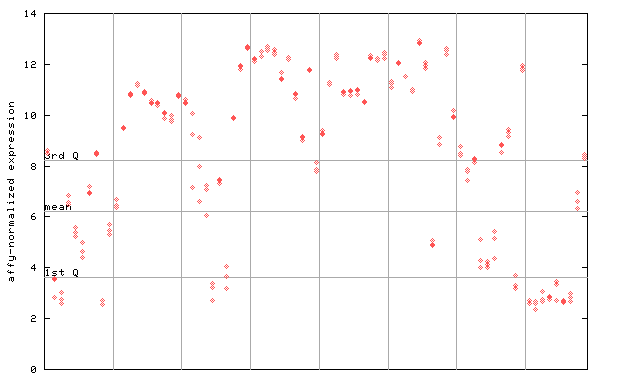
X axis is samples (pdf file), and Y axis is log2-expression. |
|||||||||||||
| AtGenExpress* (Stress) |
245275_at
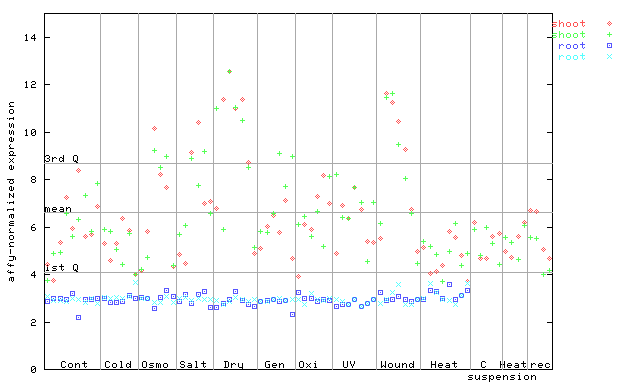
X axis is samples (pdf file), and Y axis is log2-expression. |
|||||||||||||
| AtGenExpress* (Hormone) |
245275_at
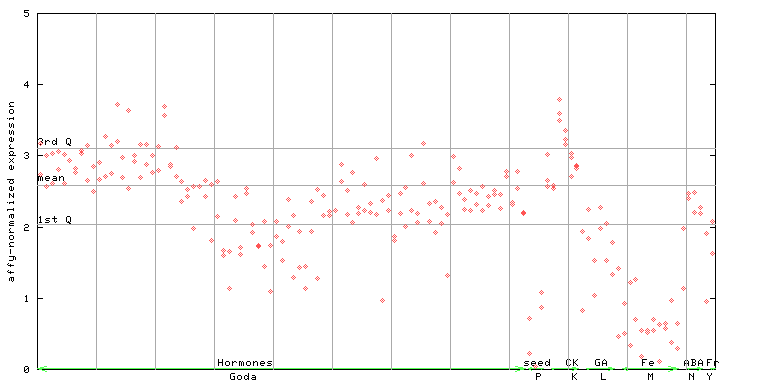
X axis is samples (xls file), and Y axis is log-expression. |
|||||||||||||


| Link to other DBs | ||
| Entrez Gene ID | 827185 |
|
| Refseq ID (protein) | NP_001329367.1 | |
| NP_001329368.1 | |
|
| NP_567460.1 | |
|
| NP_849389.1 | |
|
The preparation time of this page was 0.1 [sec].