[←][→] ath
| functional annotation | ||||||||||||||
| Function | Integrase-type DNA-binding superfamily protein |


|
||||||||||||
| GO BP |
|
|||||||||||||
| GO CC |
|
|||||||||||||
| GO MF |
|
|||||||||||||
| KEGG | ||||||||||||||
| Protein | NP_193580.1 | |||||||||||||
| BLAST | NP_193580.1 | |||||||||||||
| Orthologous | [Ortholog page] LOC7470237 (ppo) LOC11443318 (mtr) LOC100241795 (vvi) LOC100820226 (gma) LOC101250863 (sly) LOC103630736 (zma) LOC103636999 (zma) LOC103856383 (bra) LOC112999553 (gma) | |||||||||||||
| Subcellular localization wolf |
|
|||||||||||||
| Subcellular localization TargetP |
|
|||||||||||||
| Gene coexpression | ||||||||||||||
| Network*for coexpressed genes |
||||||||||||||
|---|---|---|---|---|---|---|---|---|---|---|---|---|---|---|
| Coexpressed gene list |
[Coexpressed gene list for AT4G18450] | |||||||||||||
| Gene expression | ||||||||||||||
| All samples | [Expression pattern for all samples] | |||||||||||||
| AtGenExpress* (Development) |
254674_at
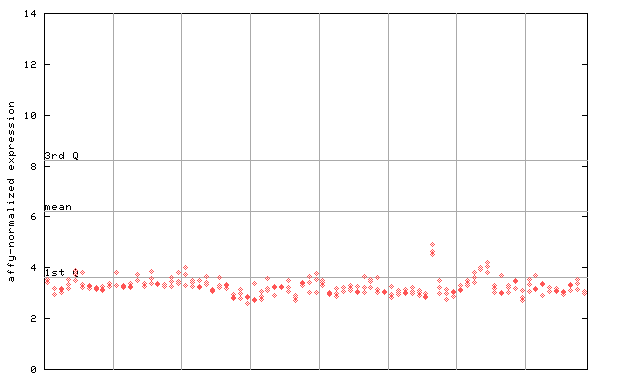
X axis is samples (pdf file), and Y axis is log2-expression. |
|||||||||||||
| AtGenExpress* (Stress) |
254674_at
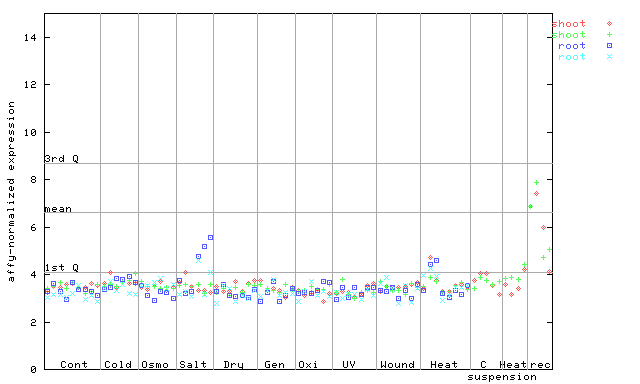
X axis is samples (pdf file), and Y axis is log2-expression. |
|||||||||||||
| AtGenExpress* (Hormone) |
254674_at
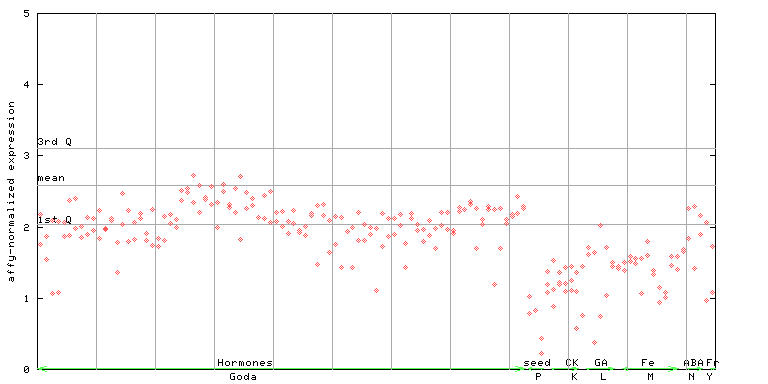
X axis is samples (xls file), and Y axis is log-expression. |
|||||||||||||

| Link to other DBs | ||
| Entrez Gene ID | 827576 |
|
| Refseq ID (protein) | NP_193580.1 | |
The preparation time of this page was 0.2 [sec].