[←][→] ath
| functional annotation | |||||||||||||||||||||||||||||||
| Function | plastid transcriptionally active 9 |


|
|||||||||||||||||||||||||||||
| GO BP |
|
||||||||||||||||||||||||||||||
| GO CC |
|
||||||||||||||||||||||||||||||
| GO MF |
|
||||||||||||||||||||||||||||||
| KEGG | |||||||||||||||||||||||||||||||
| Protein | NP_001031674.1 NP_567593.1 | ||||||||||||||||||||||||||||||
| BLAST | NP_001031674.1 NP_567593.1 | ||||||||||||||||||||||||||||||
| Orthologous | [Ortholog page] OSB3 (ath) OSB4 (ath) LOC4325759 (osa) LOC11436977 (mtr) LOC100278261 (zma) LOC100779746 (gma) LOC100788700 (gma) LOC100852454 (vvi) LOC101253926 (sly) LOC103827828 (bra) LOC103840276 (bra) LOC103861072 (bra) | ||||||||||||||||||||||||||||||
| Subcellular localization wolf |
|
||||||||||||||||||||||||||||||
| Subcellular localization TargetP |
|
||||||||||||||||||||||||||||||
| Gene coexpression | |||||||||||||||||||||||||||||||
| Network*for coexpressed genes |
|
||||||||||||||||||||||||||||||
|---|---|---|---|---|---|---|---|---|---|---|---|---|---|---|---|---|---|---|---|---|---|---|---|---|---|---|---|---|---|---|---|
| Coexpressed gene list |
[Coexpressed gene list for PTAC9] | ||||||||||||||||||||||||||||||
| Gene expression | |||||||||||||||||||||||||||||||
| All samples | [Expression pattern for all samples] | ||||||||||||||||||||||||||||||
| AtGenExpress* (Development) |
254503_at
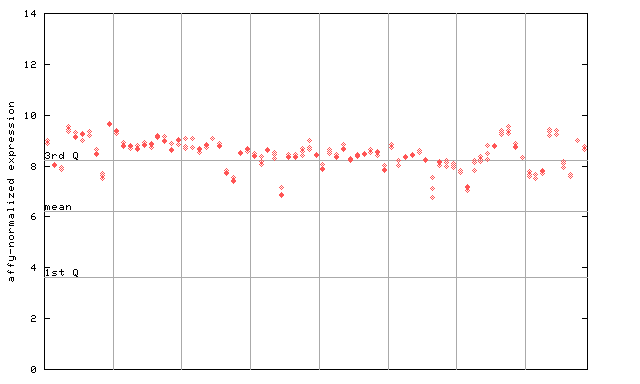
X axis is samples (pdf file), and Y axis is log2-expression. |
||||||||||||||||||||||||||||||
| AtGenExpress* (Stress) |
254503_at
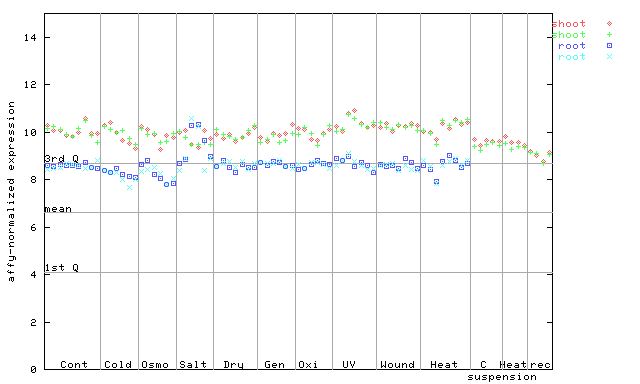
X axis is samples (pdf file), and Y axis is log2-expression. |
||||||||||||||||||||||||||||||
| AtGenExpress* (Hormone) |
254503_at
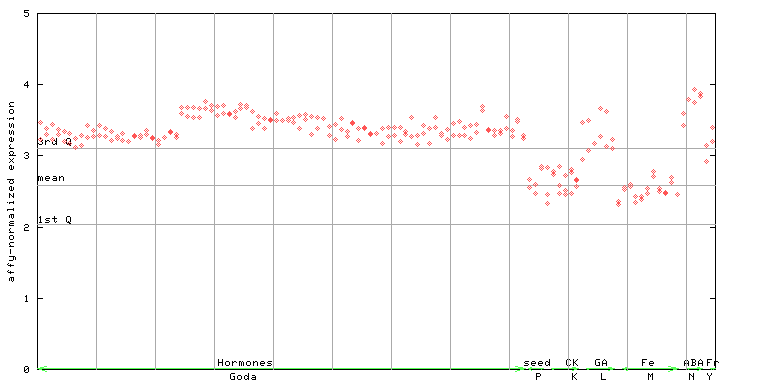
X axis is samples (xls file), and Y axis is log-expression. |
||||||||||||||||||||||||||||||


| Link to other DBs | ||
| Entrez Gene ID | 827746 |
|
| Refseq ID (protein) | NP_001031674.1 | |
| NP_567593.1 | |
|
The preparation time of this page was 0.2 [sec].