[←][→] ath
| functional annotation | ||||||||||||||||||||||||||||||||||||||||||||||||||||||
| Function | 26S proteasome regulatory subunit Rpn7 |


|
||||||||||||||||||||||||||||||||||||||||||||||||||||
| GO BP |
|
|||||||||||||||||||||||||||||||||||||||||||||||||||||
| GO CC |
|
|||||||||||||||||||||||||||||||||||||||||||||||||||||
| GO MF |
|
|||||||||||||||||||||||||||||||||||||||||||||||||||||
| KEGG | ath03050 [list] [network] Proteasome (60 genes) |  |
||||||||||||||||||||||||||||||||||||||||||||||||||||
| Protein | NP_567709.1 NP_974611.1 | |||||||||||||||||||||||||||||||||||||||||||||||||||||
| BLAST | NP_567709.1 NP_974611.1 | |||||||||||||||||||||||||||||||||||||||||||||||||||||
| Orthologous | [Ortholog page] LOC4329887 (osa) LOC4336206 (osa) LOC11426380 (mtr) LOC100258219 (vvi) LOC100282303 (zma) LOC100282612 (zma) LOC100810692 (gma) LOC101267619 (sly) LOC103834895 (bra) LOC103861508 (bra) LOC103862642 (bra) | |||||||||||||||||||||||||||||||||||||||||||||||||||||
| Subcellular localization wolf |
|
|||||||||||||||||||||||||||||||||||||||||||||||||||||
| Subcellular localization TargetP |
|
|||||||||||||||||||||||||||||||||||||||||||||||||||||
| Gene coexpression | ||||||||||||||||||||||||||||||||||||||||||||||||||||||
| Network*for coexpressed genes |
|
|||||||||||||||||||||||||||||||||||||||||||||||||||||
|---|---|---|---|---|---|---|---|---|---|---|---|---|---|---|---|---|---|---|---|---|---|---|---|---|---|---|---|---|---|---|---|---|---|---|---|---|---|---|---|---|---|---|---|---|---|---|---|---|---|---|---|---|---|---|
| Coexpressed gene list |
[Coexpressed gene list for AT4G24820] | |||||||||||||||||||||||||||||||||||||||||||||||||||||
| Gene expression | ||||||||||||||||||||||||||||||||||||||||||||||||||||||
| All samples | [Expression pattern for all samples] | |||||||||||||||||||||||||||||||||||||||||||||||||||||
| AtGenExpress* (Development) |
254086_at
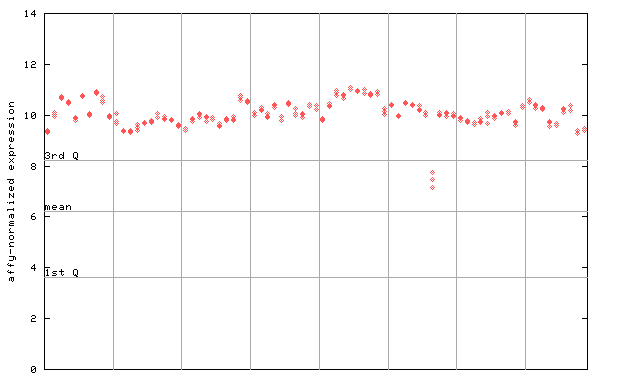
X axis is samples (pdf file), and Y axis is log2-expression. |
|||||||||||||||||||||||||||||||||||||||||||||||||||||
| AtGenExpress* (Stress) |
254086_at
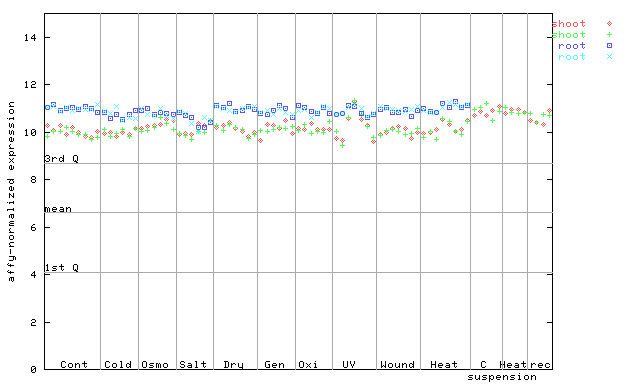
X axis is samples (pdf file), and Y axis is log2-expression. |
|||||||||||||||||||||||||||||||||||||||||||||||||||||
| AtGenExpress* (Hormone) |
254086_at
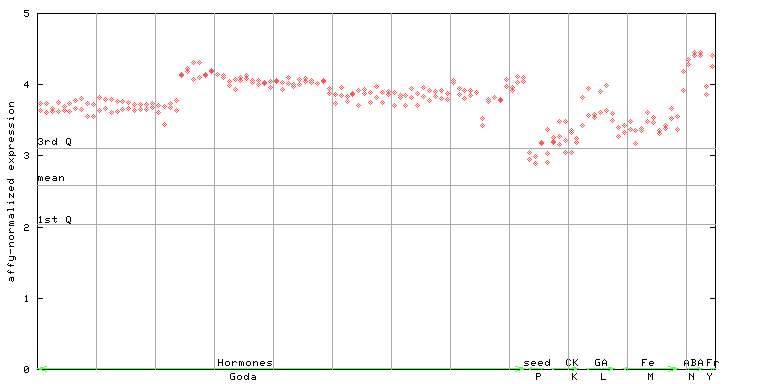
X axis is samples (xls file), and Y axis is log-expression. |
|||||||||||||||||||||||||||||||||||||||||||||||||||||


")
| Link to other DBs | ||
| Entrez Gene ID | 828585 |
|
| Refseq ID (protein) | NP_567709.1 | |
| NP_974611.1 | |
|
The preparation time of this page was 0.2 [sec].