[←][→] ath
| functional annotation | ||||||||||||||||||||||||||||||||||||||||||||||||||||||||
| Function | secE/sec61-gamma protein transport protein |


|
||||||||||||||||||||||||||||||||||||||||||||||||||||||
| GO BP |
|
|||||||||||||||||||||||||||||||||||||||||||||||||||||||
| GO CC |
|
|||||||||||||||||||||||||||||||||||||||||||||||||||||||
| GO MF |
|
|||||||||||||||||||||||||||||||||||||||||||||||||||||||
| KEGG | ath03060 [list] [network] Protein export (54 genes) |  |
||||||||||||||||||||||||||||||||||||||||||||||||||||||
| ath04141 [list] [network] Protein processing in endoplasmic reticulum (211 genes) | |
|||||||||||||||||||||||||||||||||||||||||||||||||||||||
| ath04145 [list] [network] Phagosome (82 genes) | |
|||||||||||||||||||||||||||||||||||||||||||||||||||||||
| Protein | NP_001329073.1 NP_194222.1 | |||||||||||||||||||||||||||||||||||||||||||||||||||||||
| BLAST | NP_001329073.1 NP_194222.1 | |||||||||||||||||||||||||||||||||||||||||||||||||||||||
| Orthologous | ||||||||||||||||||||||||||||||||||||||||||||||||||||||||
| Subcellular localization wolf |
|
|||||||||||||||||||||||||||||||||||||||||||||||||||||||
| Subcellular localization TargetP |
|
|||||||||||||||||||||||||||||||||||||||||||||||||||||||
| Gene coexpression | ||||||||||||||||||||||||||||||||||||||||||||||||||||||||
| Network*for coexpressed genes |
|
|||||||||||||||||||||||||||||||||||||||||||||||||||||||
|---|---|---|---|---|---|---|---|---|---|---|---|---|---|---|---|---|---|---|---|---|---|---|---|---|---|---|---|---|---|---|---|---|---|---|---|---|---|---|---|---|---|---|---|---|---|---|---|---|---|---|---|---|---|---|---|---|
| Coexpressed gene list |
[Coexpressed gene list for AT4G24920] | |||||||||||||||||||||||||||||||||||||||||||||||||||||||
| Gene expression | ||||||||||||||||||||||||||||||||||||||||||||||||||||||||
| All samples | [Expression pattern for all samples] | |||||||||||||||||||||||||||||||||||||||||||||||||||||||
| AtGenExpress* (Development) |
254083_at
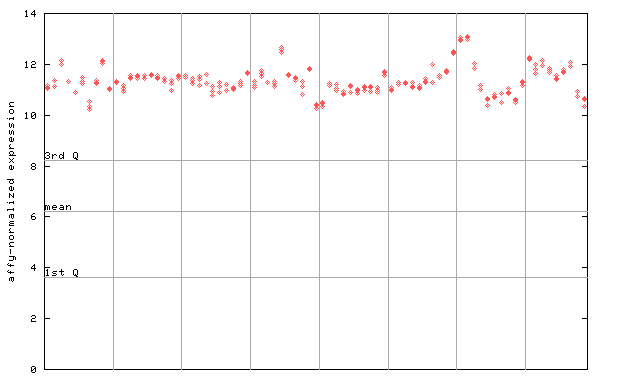
X axis is samples (pdf file), and Y axis is log2-expression. |
|||||||||||||||||||||||||||||||||||||||||||||||||||||||
| AtGenExpress* (Stress) |
254083_at
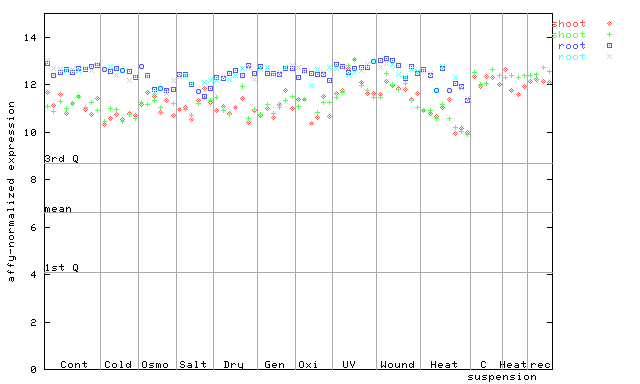
X axis is samples (pdf file), and Y axis is log2-expression. |
|||||||||||||||||||||||||||||||||||||||||||||||||||||||
| AtGenExpress* (Hormone) |
254083_at
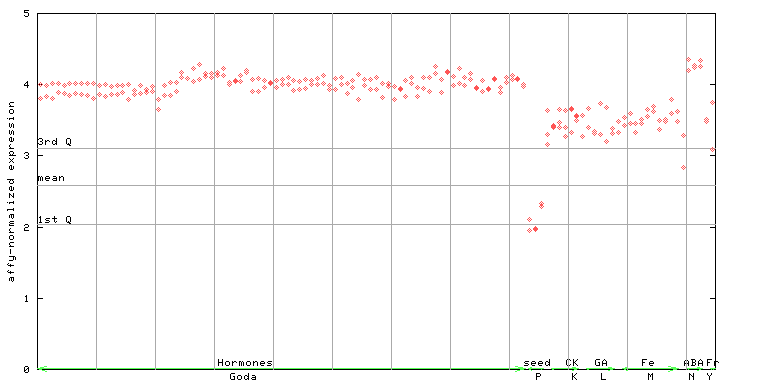
X axis is samples (xls file), and Y axis is log-expression. |
|||||||||||||||||||||||||||||||||||||||||||||||||||||||


")
")
")
")
| Link to other DBs | ||
| Entrez Gene ID | 828594 |
|
| Refseq ID (protein) | NP_001329073.1 | |
| NP_194222.1 | |
|
The preparation time of this page was 0.3 [sec].