[←][→] ath
| functional annotation | ||||||||||||||||||||||||||||||
| Function | Nodulin MtN3 family protein |


|
||||||||||||||||||||||||||||
| GO BP |
|
|||||||||||||||||||||||||||||
| GO CC |
|
|||||||||||||||||||||||||||||
| GO MF |
|
|||||||||||||||||||||||||||||
| KEGG | ||||||||||||||||||||||||||||||
| Protein | NP_194231.1 | |||||||||||||||||||||||||||||
| BLAST | NP_194231.1 | |||||||||||||||||||||||||||||
| Orthologous | [Ortholog page] SWEET13 (ath) LOC103834889 (bra) LOC103848657 (bra) LOC103861520 (bra) LOC103862809 (bra) | |||||||||||||||||||||||||||||
| Subcellular localization wolf |
|
|||||||||||||||||||||||||||||
| Subcellular localization TargetP |
|
|||||||||||||||||||||||||||||
| Gene coexpression | ||||||||||||||||||||||||||||||
| Network*for coexpressed genes |
||||||||||||||||||||||||||||||
|---|---|---|---|---|---|---|---|---|---|---|---|---|---|---|---|---|---|---|---|---|---|---|---|---|---|---|---|---|---|---|
| Coexpressed gene list |
[Coexpressed gene list for SWEET14] | |||||||||||||||||||||||||||||
| Gene expression | ||||||||||||||||||||||||||||||
| All samples | [Expression pattern for all samples] | |||||||||||||||||||||||||||||
| AtGenExpress* (Development) |
254090_at
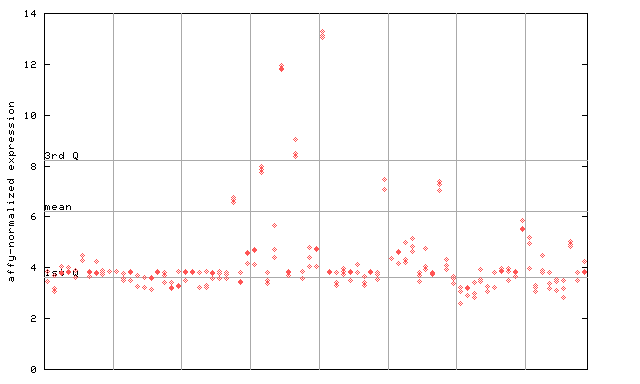
X axis is samples (pdf file), and Y axis is log2-expression. |
|||||||||||||||||||||||||||||
| AtGenExpress* (Stress) |
254090_at
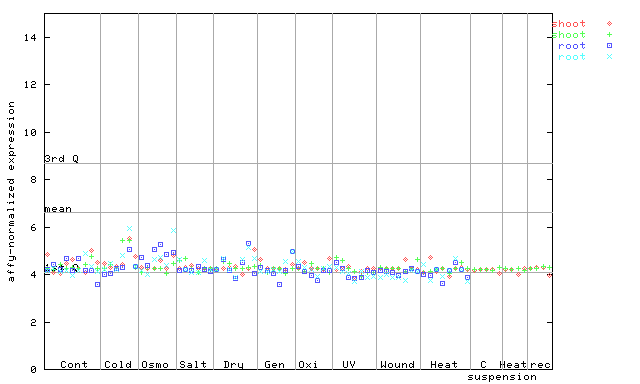
X axis is samples (pdf file), and Y axis is log2-expression. |
|||||||||||||||||||||||||||||
| AtGenExpress* (Hormone) |
254090_at
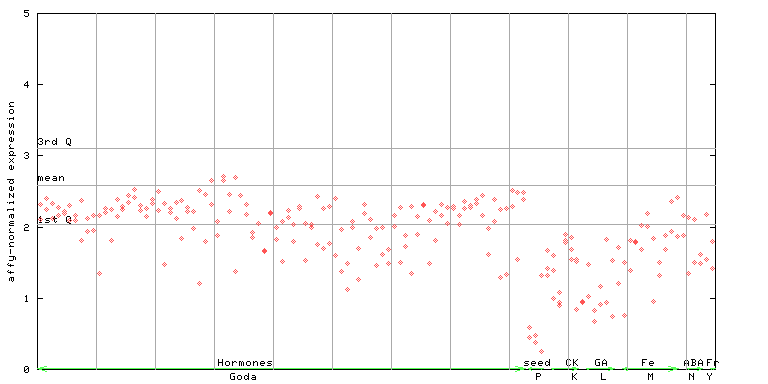
X axis is samples (xls file), and Y axis is log-expression. |
|||||||||||||||||||||||||||||

| Link to other DBs | ||
| Entrez Gene ID | 828604 |
|
| Refseq ID (protein) | NP_194231.1 | |
The preparation time of this page was 0.2 [sec].