[←][→] ath
| functional annotation | ||||||||||||||||||
| Function | magnesium transport 5 |


|
||||||||||||||||
| GO BP |
|
|||||||||||||||||
| GO CC |
|
|||||||||||||||||
| GO MF |
|
|||||||||||||||||
| KEGG | ||||||||||||||||||
| Protein | NP_194587.2 | |||||||||||||||||
| BLAST | NP_194587.2 | |||||||||||||||||
| Orthologous | [Ortholog page] MGT6 (ath) LOC4331553 (osa) LOC4349276 (osa) LOC7454907 (ppo) LOC11408351 (mtr) LOC100246349 (vvi) LOC100272750 (zma) LOC100786220 (gma) LOC100812561 (gma) LOC101247864 (sly) LOC103631689 (zma) LOC103637617 (zma) LOC103841760 (bra) LOC103869507 (bra) | |||||||||||||||||
| Subcellular localization wolf |
|
|||||||||||||||||
| Subcellular localization TargetP |
|
|||||||||||||||||
| Gene coexpression | ||||||||||||||||||
| Network*for coexpressed genes |
||||||||||||||||||
|---|---|---|---|---|---|---|---|---|---|---|---|---|---|---|---|---|---|---|
| Coexpressed gene list |
[Coexpressed gene list for MGT5] | |||||||||||||||||
| Gene expression | ||||||||||||||||||
| All samples | [Expression pattern for all samples] | |||||||||||||||||
| AtGenExpress* (Development) |
253781_at
X axis is samples (pdf file), and Y axis is log2-expression. |
|||||||||||||||||
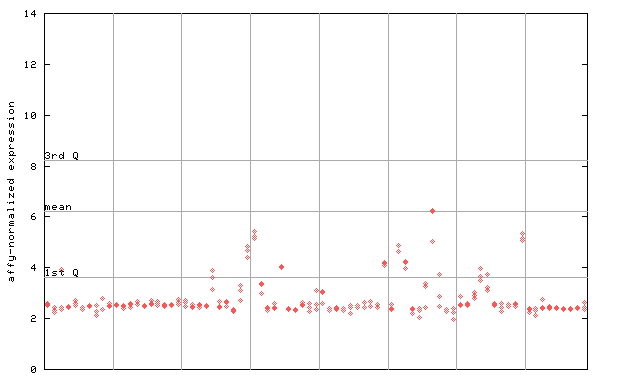
| AtGenExpress* (Stress) |
253781_at
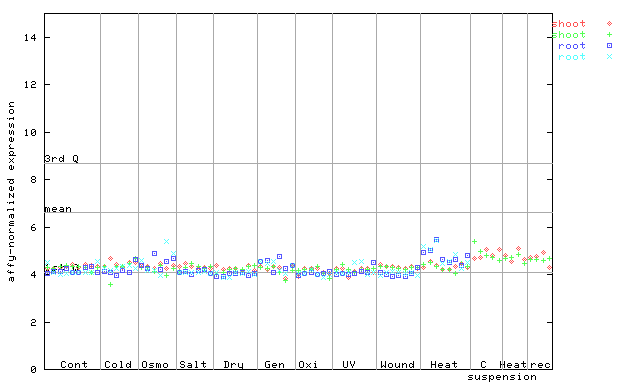
X axis is samples (pdf file), and Y axis is log2-expression. |
|||||||||||||||||
| AtGenExpress* (Hormone) |
253781_at
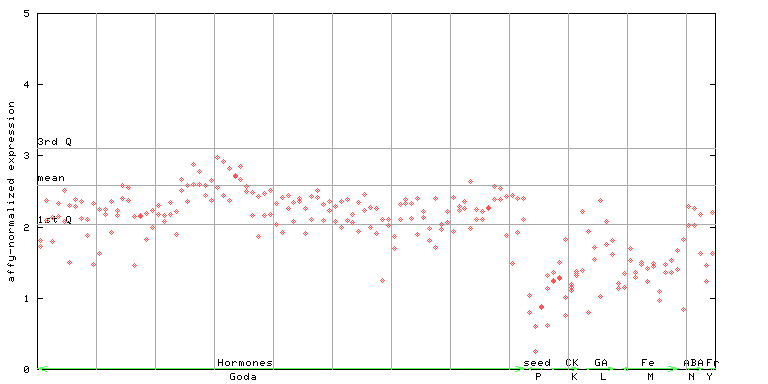
X axis is samples (xls file), and Y axis is log-expression. |
|||||||||||||||||

| Link to other DBs | ||
| Entrez Gene ID | 828976 |
|
| Refseq ID (protein) | NP_194587.2 | |
The preparation time of this page was 0.1 [sec].