[←][→] ath
| functional annotation | ||||||||||||||||||||||||||||||||||||||||||||||||||||||||||||||||||||||||||||||||
| Function | hexokinase 1 |


|
||||||||||||||||||||||||||||||||||||||||||||||||||||||||||||||||||||||||||||||
| GO BP |
|
|||||||||||||||||||||||||||||||||||||||||||||||||||||||||||||||||||||||||||||||
| GO CC |
|
|||||||||||||||||||||||||||||||||||||||||||||||||||||||||||||||||||||||||||||||
| GO MF |
|
|||||||||||||||||||||||||||||||||||||||||||||||||||||||||||||||||||||||||||||||
| KEGG | ath00010 [list] [network] Glycolysis / Gluconeogenesis (116 genes) |  |
||||||||||||||||||||||||||||||||||||||||||||||||||||||||||||||||||||||||||||||
| ath00051 [list] [network] Fructose and mannose metabolism (64 genes) | |
|||||||||||||||||||||||||||||||||||||||||||||||||||||||||||||||||||||||||||||||
| ath00052 [list] [network] Galactose metabolism (57 genes) | |
|||||||||||||||||||||||||||||||||||||||||||||||||||||||||||||||||||||||||||||||
| ath00500 [list] [network] Starch and sucrose metabolism (165 genes) | |
|||||||||||||||||||||||||||||||||||||||||||||||||||||||||||||||||||||||||||||||
| ath00520 [list] [network] Amino sugar and nucleotide sugar metabolism (131 genes) | |
|||||||||||||||||||||||||||||||||||||||||||||||||||||||||||||||||||||||||||||||
| ath01200 [list] [network] Carbon metabolism (273 genes) | |
|||||||||||||||||||||||||||||||||||||||||||||||||||||||||||||||||||||||||||||||
| Protein | NP_194642.1 | |||||||||||||||||||||||||||||||||||||||||||||||||||||||||||||||||||||||||||||||
| BLAST | NP_194642.1 | |||||||||||||||||||||||||||||||||||||||||||||||||||||||||||||||||||||||||||||||
| Orthologous | [Ortholog page] LOC542510 (zma) Hxk2 (sly) hxk1 (sly) HXK3 (sly) HXK2 (ath) LOC4324666 (osa) LOC4326547 (osa) LOC4338010 (osa) LOC4339361 (osa) LOC4339420 (osa) LOC7461567 (ppo) LOC7470585 (ppo) LOC11408101 (mtr) LOC11421234 (mtr) LOC25496982 (mtr) LOC100170246 (zma) LOC100242358 (vvi) LOC100244595 (vvi) LOC100279587 (zma) LOC100283735 (zma) LOC100783175 (gma) LOC100783774 (gma) LOC100783775 (gma) LOC100786385 (gma) LOC100796995 (gma) LOC100808324 (gma) LOC103651223 (zma) LOC103828273 (bra) LOC103837987 (bra) | |||||||||||||||||||||||||||||||||||||||||||||||||||||||||||||||||||||||||||||||
| Subcellular localization wolf |
|
|||||||||||||||||||||||||||||||||||||||||||||||||||||||||||||||||||||||||||||||
| Subcellular localization TargetP |
|
|||||||||||||||||||||||||||||||||||||||||||||||||||||||||||||||||||||||||||||||
| Gene coexpression | ||||||||||||||||||||||||||||||||||||||||||||||||||||||||||||||||||||||||||||||||
| Network*for coexpressed genes |
|
|||||||||||||||||||||||||||||||||||||||||||||||||||||||||||||||||||||||||||||||
|---|---|---|---|---|---|---|---|---|---|---|---|---|---|---|---|---|---|---|---|---|---|---|---|---|---|---|---|---|---|---|---|---|---|---|---|---|---|---|---|---|---|---|---|---|---|---|---|---|---|---|---|---|---|---|---|---|---|---|---|---|---|---|---|---|---|---|---|---|---|---|---|---|---|---|---|---|---|---|---|---|
| Coexpressed gene list |
[Coexpressed gene list for HXK1] | |||||||||||||||||||||||||||||||||||||||||||||||||||||||||||||||||||||||||||||||
| Gene expression | ||||||||||||||||||||||||||||||||||||||||||||||||||||||||||||||||||||||||||||||||
| All samples | [Expression pattern for all samples] | |||||||||||||||||||||||||||||||||||||||||||||||||||||||||||||||||||||||||||||||
| AtGenExpress* (Development) |
253705_at
X axis is samples (pdf file), and Y axis is log2-expression. |
|||||||||||||||||||||||||||||||||||||||||||||||||||||||||||||||||||||||||||||||
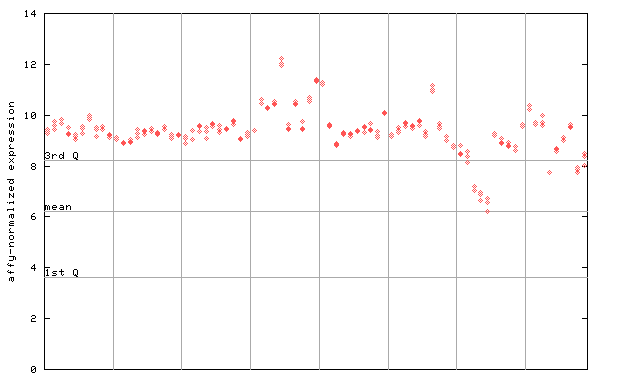
| AtGenExpress* (Stress) |
253705_at
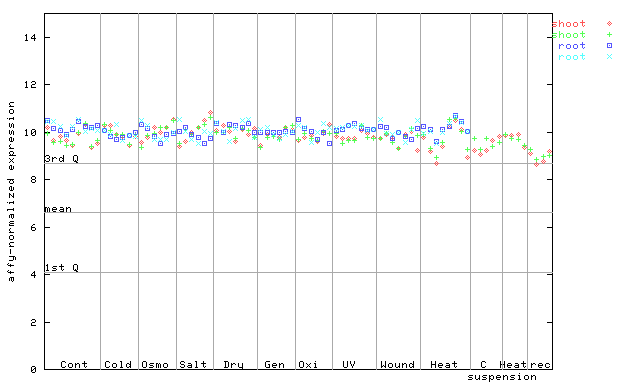
X axis is samples (pdf file), and Y axis is log2-expression. |
|||||||||||||||||||||||||||||||||||||||||||||||||||||||||||||||||||||||||||||||
| AtGenExpress* (Hormone) |
253705_at
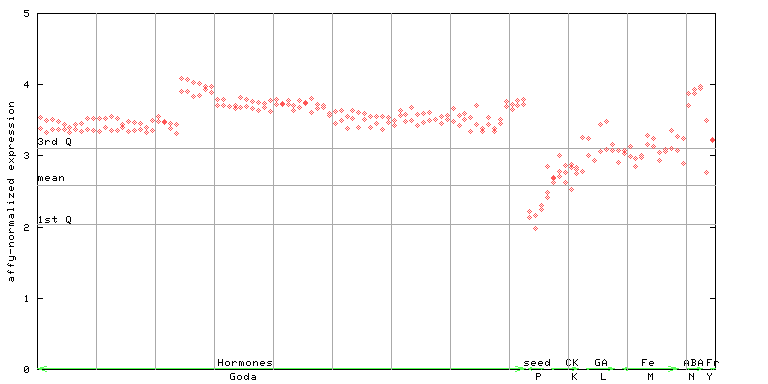
X axis is samples (xls file), and Y axis is log-expression. |
|||||||||||||||||||||||||||||||||||||||||||||||||||||||||||||||||||||||||||||||


")
")
")
")
")
| Link to other DBs | ||
| Entrez Gene ID | 829034 |
|
| Refseq ID (protein) | NP_194642.1 | |
The preparation time of this page was 0.2 [sec].