[←][→] ath
| functional annotation | ||||||||||||||||||||||||||||||||||||||||||||||||||||||
| Function | transmembrane protein |


|
||||||||||||||||||||||||||||||||||||||||||||||||||||
| GO BP |
|
|||||||||||||||||||||||||||||||||||||||||||||||||||||
| GO CC |
|
|||||||||||||||||||||||||||||||||||||||||||||||||||||
| GO MF |
|
|||||||||||||||||||||||||||||||||||||||||||||||||||||
| KEGG | ||||||||||||||||||||||||||||||||||||||||||||||||||||||
| Protein | NP_001154276.1 NP_567832.1 | |||||||||||||||||||||||||||||||||||||||||||||||||||||
| BLAST | NP_001154276.1 NP_567832.1 | |||||||||||||||||||||||||||||||||||||||||||||||||||||
| Orthologous | [Ortholog page] LOC4341334 (osa) LOC100242227 (vvi) LOC100276129 (zma) LOC100277314 (zma) LOC100306485 (gma) LOC101268649 (sly) LOC103853335 (bra) LOC103861900 (bra) LOC106794096 (gma) LOC112421021 (mtr) | |||||||||||||||||||||||||||||||||||||||||||||||||||||
| Subcellular localization wolf |
|
|||||||||||||||||||||||||||||||||||||||||||||||||||||
| Subcellular localization TargetP |
|
|||||||||||||||||||||||||||||||||||||||||||||||||||||
| Gene coexpression | ||||||||||||||||||||||||||||||||||||||||||||||||||||||
| Network*for coexpressed genes |
|
|||||||||||||||||||||||||||||||||||||||||||||||||||||
|---|---|---|---|---|---|---|---|---|---|---|---|---|---|---|---|---|---|---|---|---|---|---|---|---|---|---|---|---|---|---|---|---|---|---|---|---|---|---|---|---|---|---|---|---|---|---|---|---|---|---|---|---|---|---|
| Coexpressed gene list |
[Coexpressed gene list for AT4G29735] | |||||||||||||||||||||||||||||||||||||||||||||||||||||
| Gene expression | ||||||||||||||||||||||||||||||||||||||||||||||||||||||
| All samples | [Expression pattern for all samples] | |||||||||||||||||||||||||||||||||||||||||||||||||||||
| AtGenExpress* (Development) |
253694_at
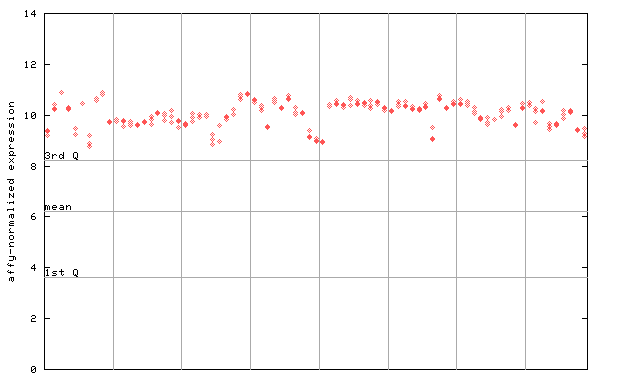
X axis is samples (pdf file), and Y axis is log2-expression. |
|||||||||||||||||||||||||||||||||||||||||||||||||||||
| AtGenExpress* (Stress) |
253694_at
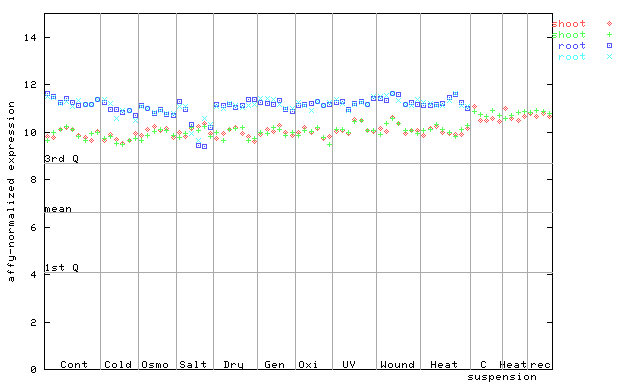
X axis is samples (pdf file), and Y axis is log2-expression. |
|||||||||||||||||||||||||||||||||||||||||||||||||||||
| AtGenExpress* (Hormone) |
253694_at
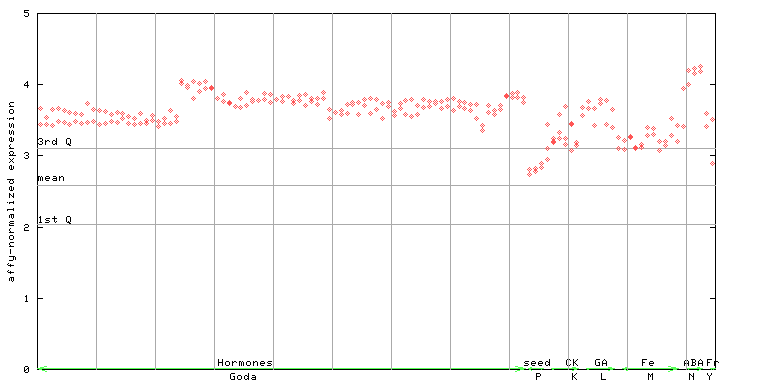
X axis is samples (xls file), and Y axis is log-expression. |
|||||||||||||||||||||||||||||||||||||||||||||||||||||


")
| Link to other DBs | ||
| Entrez Gene ID | 829095 |
|
| Refseq ID (protein) | NP_001154276.1 | |
| NP_567832.1 | |
|
The preparation time of this page was 0.3 [sec].