[←][→] ath
| functional annotation | ||||||||||||||
| Function | exocyst subunit exo70 family protein G1 |


|
||||||||||||
| GO BP |
|
|||||||||||||
| GO CC |
|
|||||||||||||
| GO MF |
|
|||||||||||||
| KEGG | ||||||||||||||
| Protein | NP_194882.2 | |||||||||||||
| BLAST | NP_194882.2 | |||||||||||||
| Orthologous | [Ortholog page] LOC4328305 (osa) LOC4341952 (osa) LOC7458726 (ppo) LOC11432831 (mtr) LOC100254158 (vvi) LOC100304328 (zma) LOC100304423 (zma) LOC100796139 (gma) LOC100816335 (gma) LOC101248224 (sly) LOC101256959 (sly) LOC103654917 (zma) LOC103834605 (bra) LOC103851770 (bra) | |||||||||||||
| Subcellular localization wolf |
|
|||||||||||||
| Subcellular localization TargetP |
|
|||||||||||||
| Gene coexpression | ||||||||||||||
| Network*for coexpressed genes |
||||||||||||||
|---|---|---|---|---|---|---|---|---|---|---|---|---|---|---|
| Coexpressed gene list |
[Coexpressed gene list for EXO70G1] | |||||||||||||
| Gene expression | ||||||||||||||
| All samples | [Expression pattern for all samples] | |||||||||||||
| AtGenExpress* (Development) |
253531_at
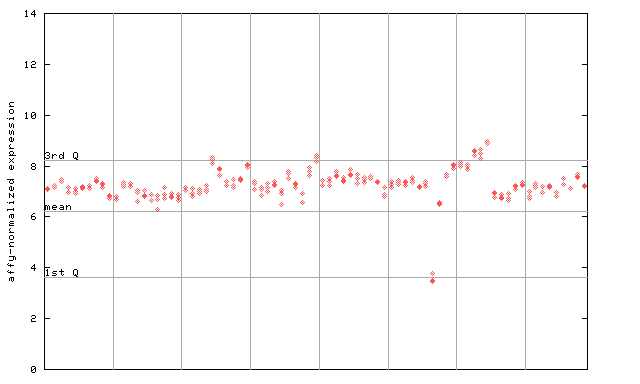
X axis is samples (pdf file), and Y axis is log2-expression. |
|||||||||||||
| AtGenExpress* (Stress) |
253531_at
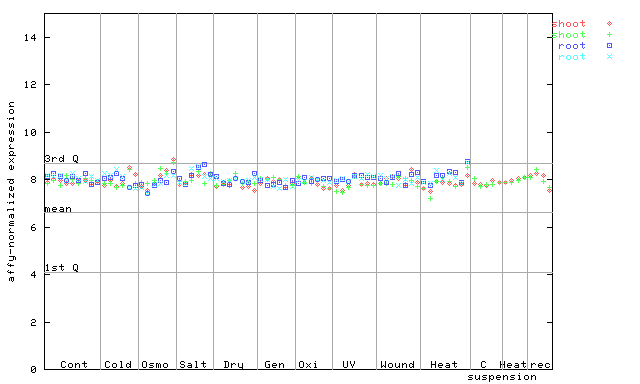
X axis is samples (pdf file), and Y axis is log2-expression. |
|||||||||||||
| AtGenExpress* (Hormone) |
253531_at
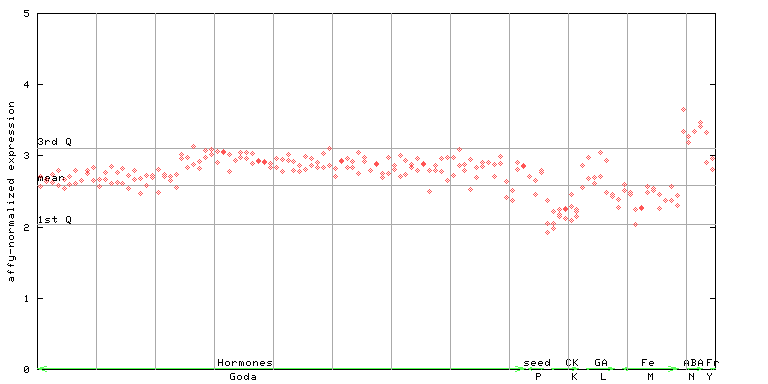
X axis is samples (xls file), and Y axis is log-expression. |
|||||||||||||

| Link to other DBs | ||
| Entrez Gene ID | 829281 |
|
| Refseq ID (protein) | NP_194882.2 | |
The preparation time of this page was 0.2 [sec].