[←][→] ath
| functional annotation | |||||||||||||||||||||||||||||||
| Function | high chlorophyll fluorescence 153 |


|
|||||||||||||||||||||||||||||
| GO BP |
|
||||||||||||||||||||||||||||||
| GO CC |
|
||||||||||||||||||||||||||||||
| GO MF |
|
||||||||||||||||||||||||||||||
| KEGG | |||||||||||||||||||||||||||||||
| Protein | NP_194884.1 | ||||||||||||||||||||||||||||||
| BLAST | NP_194884.1 | ||||||||||||||||||||||||||||||
| Orthologous | [Ortholog page] LOC4326517 (osa) LOC7496022 (ppo) LOC11418577 (mtr) LOC100256905 (vvi) LOC100277443 (zma) LOC100797970 (gma) LOC101258592 (sly) LOC103636299 (zma) LOC103851744 (bra) LOC103862065 (bra) | ||||||||||||||||||||||||||||||
| Subcellular localization wolf |
|
||||||||||||||||||||||||||||||
| Subcellular localization TargetP |
|
||||||||||||||||||||||||||||||
| Gene coexpression | |||||||||||||||||||||||||||||||
| Network*for coexpressed genes |
|
||||||||||||||||||||||||||||||
|---|---|---|---|---|---|---|---|---|---|---|---|---|---|---|---|---|---|---|---|---|---|---|---|---|---|---|---|---|---|---|---|
| Coexpressed gene list |
[Coexpressed gene list for HCF153] | ||||||||||||||||||||||||||||||
| Gene expression | |||||||||||||||||||||||||||||||
| All samples | [Expression pattern for all samples] | ||||||||||||||||||||||||||||||
| AtGenExpress* (Development) |
253537_at
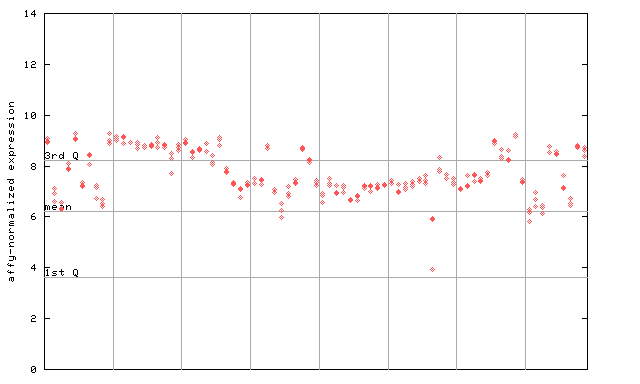
X axis is samples (pdf file), and Y axis is log2-expression. |
||||||||||||||||||||||||||||||
| AtGenExpress* (Stress) |
253537_at
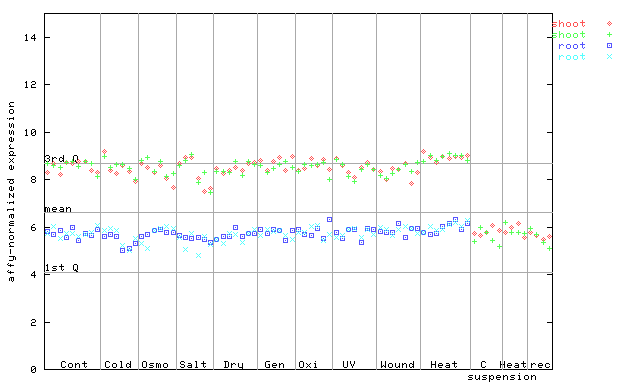
X axis is samples (pdf file), and Y axis is log2-expression. |
||||||||||||||||||||||||||||||
| AtGenExpress* (Hormone) |
253537_at
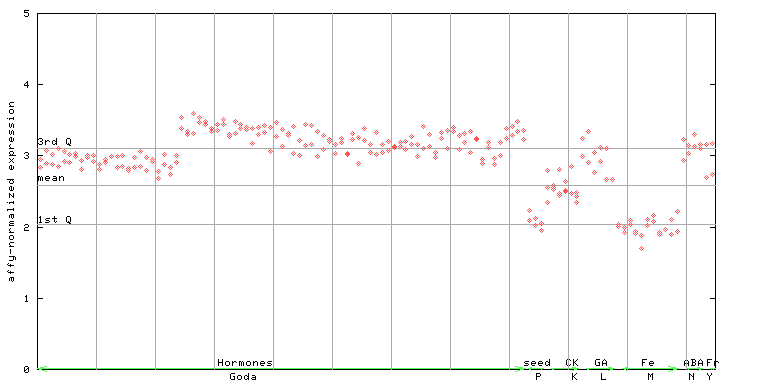
X axis is samples (xls file), and Y axis is log-expression. |
||||||||||||||||||||||||||||||


| Link to other DBs | ||
| Entrez Gene ID | 829283 |
|
| Refseq ID (protein) | NP_194884.1 | |
The preparation time of this page was 0.1 [sec].