[←][→] ath
| functional annotation | ||||||||||||||||||||||||||||||||||
| Function | G patch domain protein |


|
||||||||||||||||||||||||||||||||
| GO BP |
|
|||||||||||||||||||||||||||||||||
| GO CC |
|
|||||||||||||||||||||||||||||||||
| GO MF |
|
|||||||||||||||||||||||||||||||||
| KEGG | ||||||||||||||||||||||||||||||||||
| Protein | NP_195095.2 | |||||||||||||||||||||||||||||||||
| BLAST | NP_195095.2 | |||||||||||||||||||||||||||||||||
| Orthologous | [Ortholog page] LOC4342718 (osa) LOC7478681 (ppo) LOC9269926 (osa) LOC11434347 (mtr) LOC100266970 (vvi) LOC100277511 (zma) LOC100796417 (gma) LOC100797688 (gma) LOC101255635 (sly) LOC102668565 (gma) LOC103633327 (zma) LOC103845070 (bra) LOC103859197 (bra) LOC108869003 (bra) LOC108869638 (bra) | |||||||||||||||||||||||||||||||||
| Subcellular localization wolf |
|
|||||||||||||||||||||||||||||||||
| Subcellular localization TargetP |
|
|||||||||||||||||||||||||||||||||
| Gene coexpression | ||||||||||||||||||||||||||||||||||
| Network*for coexpressed genes |
|
|||||||||||||||||||||||||||||||||
|---|---|---|---|---|---|---|---|---|---|---|---|---|---|---|---|---|---|---|---|---|---|---|---|---|---|---|---|---|---|---|---|---|---|---|
| Coexpressed gene list |
[Coexpressed gene list for AT4G33690] | |||||||||||||||||||||||||||||||||
| Gene expression | ||||||||||||||||||||||||||||||||||
| All samples | [Expression pattern for all samples] | |||||||||||||||||||||||||||||||||
| AtGenExpress* (Development) |
253350_at
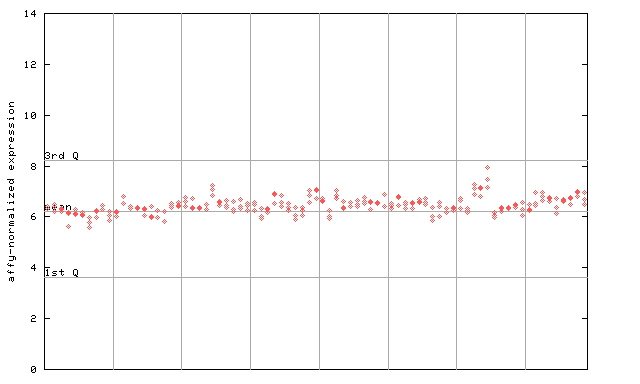
X axis is samples (pdf file), and Y axis is log2-expression. |
|||||||||||||||||||||||||||||||||
| AtGenExpress* (Stress) |
253350_at
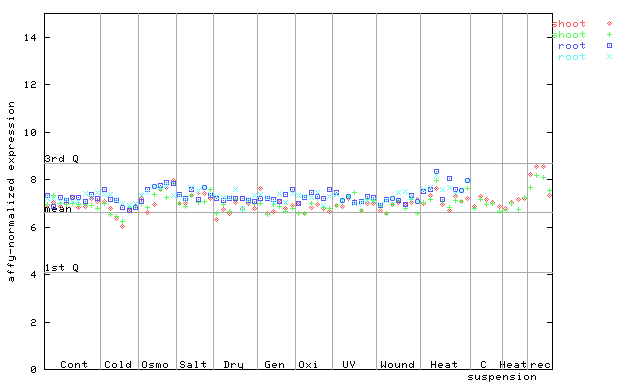
X axis is samples (pdf file), and Y axis is log2-expression. |
|||||||||||||||||||||||||||||||||
| AtGenExpress* (Hormone) |
253350_at
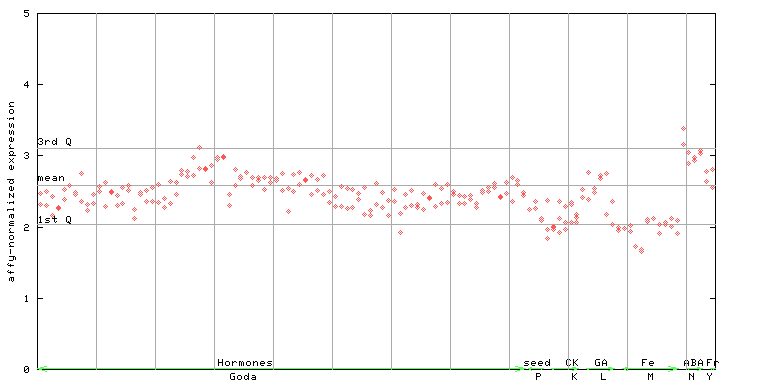
X axis is samples (xls file), and Y axis is log-expression. |
|||||||||||||||||||||||||||||||||


")
| Link to other DBs | ||
| Entrez Gene ID | 829511 |
|
| Refseq ID (protein) | NP_195095.2 | |
The preparation time of this page was 0.2 [sec].