[←][→] ath
| functional annotation | |||||||||||||||||||||||||||||||||||||||||||||||||
| Function | hypothetical protein |


|
|||||||||||||||||||||||||||||||||||||||||||||||
| GO BP |
|
||||||||||||||||||||||||||||||||||||||||||||||||
| GO CC |
|
||||||||||||||||||||||||||||||||||||||||||||||||
| GO MF |
|
||||||||||||||||||||||||||||||||||||||||||||||||
| KEGG | |||||||||||||||||||||||||||||||||||||||||||||||||
| Protein | NP_001329243.1 NP_001329244.1 NP_001329245.1 NP_001329246.1 NP_567963.3 NP_974680.1 | ||||||||||||||||||||||||||||||||||||||||||||||||
| BLAST | NP_001329243.1 NP_001329244.1 NP_001329245.1 NP_001329246.1 NP_567963.3 NP_974680.1 | ||||||||||||||||||||||||||||||||||||||||||||||||
| Orthologous | [Ortholog page] AT2G15000 (ath) LOC7478717 (ppo) LOC11405777 (mtr) LOC25485373 (mtr) LOC100260985 (vvi) LOC100807280 (gma) LOC100809521 (gma) LOC101248148 (sly) LOC101251431 (sly) LOC103828478 (bra) LOC103839786 (bra) LOC103860412 (bra) LOC106795008 (gma) | ||||||||||||||||||||||||||||||||||||||||||||||||
| Subcellular localization wolf |
|
||||||||||||||||||||||||||||||||||||||||||||||||
| Subcellular localization TargetP |
|
||||||||||||||||||||||||||||||||||||||||||||||||
| Gene coexpression | |||||||||||||||||||||||||||||||||||||||||||||||||
| Network*for coexpressed genes |
|
||||||||||||||||||||||||||||||||||||||||||||||||
|---|---|---|---|---|---|---|---|---|---|---|---|---|---|---|---|---|---|---|---|---|---|---|---|---|---|---|---|---|---|---|---|---|---|---|---|---|---|---|---|---|---|---|---|---|---|---|---|---|---|
| Coexpressed gene list |
[Coexpressed gene list for AT4G34265] | ||||||||||||||||||||||||||||||||||||||||||||||||
| Gene expression | |||||||||||||||||||||||||||||||||||||||||||||||||
| All samples | [Expression pattern for all samples] | ||||||||||||||||||||||||||||||||||||||||||||||||
| AtGenExpress* (Development) |
253234_at
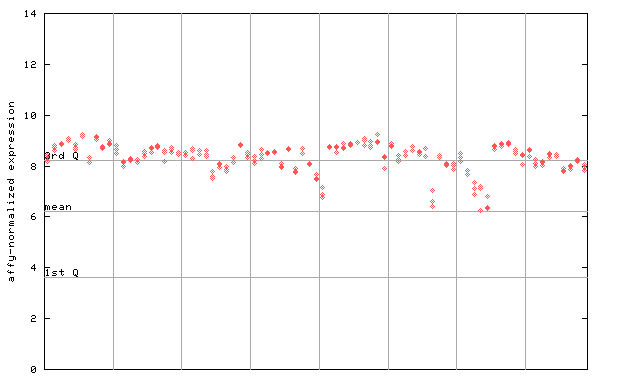
X axis is samples (pdf file), and Y axis is log2-expression. |
||||||||||||||||||||||||||||||||||||||||||||||||
| AtGenExpress* (Stress) |
253234_at
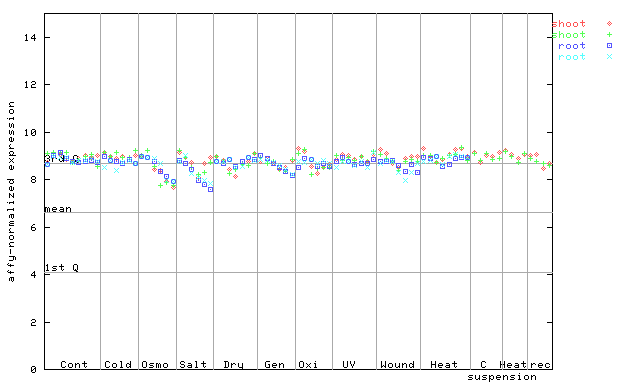
X axis is samples (pdf file), and Y axis is log2-expression. |
||||||||||||||||||||||||||||||||||||||||||||||||
| AtGenExpress* (Hormone) |
253234_at
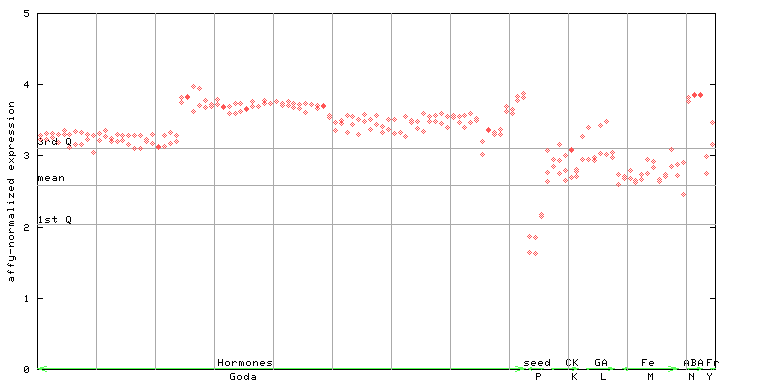
X axis is samples (xls file), and Y axis is log-expression. |
||||||||||||||||||||||||||||||||||||||||||||||||


")
| Link to other DBs | ||
| Entrez Gene ID | 829576 |
|
| Refseq ID (protein) | NP_001329243.1 | |
| NP_001329244.1 | |
|
| NP_001329245.1 | |
|
| NP_001329246.1 | |
|
| NP_567963.3 | |
|
| NP_974680.1 | |
|
The preparation time of this page was 0.2 [sec].