[←][→] ath
| functional annotation | |||||||||||||||||||||||||||||||||||||||||
| Function | Phosphorylase superfamily protein |


|
|||||||||||||||||||||||||||||||||||||||
| GO BP |
|
||||||||||||||||||||||||||||||||||||||||
| GO CC |
|
||||||||||||||||||||||||||||||||||||||||
| GO MF |
|
||||||||||||||||||||||||||||||||||||||||
| KEGG | ath00270 [list] [network] Cysteine and methionine metabolism (121 genes) |  |
|||||||||||||||||||||||||||||||||||||||
| Protein | NP_001329682.1 NP_001329683.1 NP_001329684.1 NP_001329685.1 NP_195210.2 | ||||||||||||||||||||||||||||||||||||||||
| BLAST | NP_001329682.1 NP_001329683.1 NP_001329684.1 NP_001329685.1 NP_195210.2 | ||||||||||||||||||||||||||||||||||||||||
| Orthologous | [Ortholog page] MTN1 (ath) LOC4339898 (osa) LOC7463974 (ppo) LOC7477858 (ppo) LOC11418454 (mtr) LOC100193148 (zma) GRIP58 (vvi) LOC100286299 (zma) LOC100779419 (gma) LOC100800253 (gma) LOC101256428 (sly) LOC103834385 (bra) LOC103834389 (bra) LOC103835162 (bra) | ||||||||||||||||||||||||||||||||||||||||
| Subcellular localization wolf |
|
||||||||||||||||||||||||||||||||||||||||
| Subcellular localization TargetP |
|
||||||||||||||||||||||||||||||||||||||||
| Gene coexpression | |||||||||||||||||||||||||||||||||||||||||
| Network*for coexpressed genes |
|
||||||||||||||||||||||||||||||||||||||||
|---|---|---|---|---|---|---|---|---|---|---|---|---|---|---|---|---|---|---|---|---|---|---|---|---|---|---|---|---|---|---|---|---|---|---|---|---|---|---|---|---|---|
| Coexpressed gene list |
[Coexpressed gene list for AT4G34840] | ||||||||||||||||||||||||||||||||||||||||
| Gene expression | |||||||||||||||||||||||||||||||||||||||||
| All samples | [Expression pattern for all samples] | ||||||||||||||||||||||||||||||||||||||||
| AtGenExpress* (Development) |
253210_at
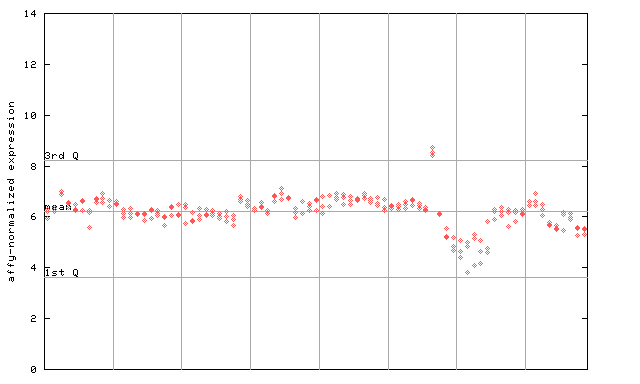
X axis is samples (pdf file), and Y axis is log2-expression. |
||||||||||||||||||||||||||||||||||||||||
| AtGenExpress* (Stress) |
253210_at
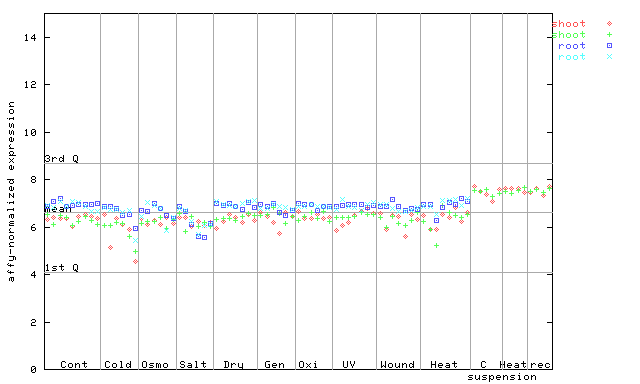
X axis is samples (pdf file), and Y axis is log2-expression. |
||||||||||||||||||||||||||||||||||||||||
| AtGenExpress* (Hormone) |
253210_at
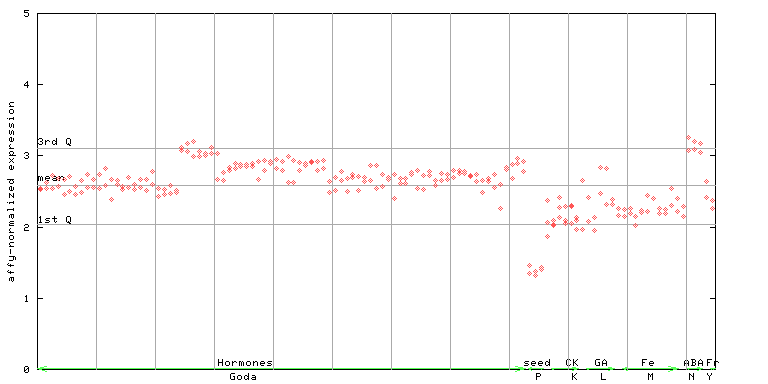
X axis is samples (xls file), and Y axis is log-expression. |
||||||||||||||||||||||||||||||||||||||||


| Link to other DBs | ||
| Entrez Gene ID | 829636 |
|
| Refseq ID (protein) | NP_001329682.1 | |
| NP_001329683.1 | |
|
| NP_001329684.1 | |
|
| NP_001329685.1 | |
|
| NP_195210.2 | |
|
The preparation time of this page was 0.3 [sec].